Azure Cosmos DB: real-time data movement using Change Feed and Azure Functions

Many people who read my Cosmos DB articles are looking for an effective way to export data to SQL, either on-demand or in real-time. After performing a search term analysis for my blog earlier this year, I had made up my mind about posting a solid article on exporting data from Cosmos DB to SQL Server.

Note that this serverless and event-based architecture may be used to not only persist Cosmos DB changes to SQL Server, but trigger alternate actions such as stream processing or loading to blob/Data Lake.

CosmosDBSearches_SQLRoadie.jpg

Real-time ETL using Cosmos DB Change Feed and Azure Functions

In this article, we will focus on creating a data pipeline to ETL (Extract, Transform and Load) Cosmos DB container changes to a SQL Server database. My main requirements or design considerations are:

  • Fault-tolerant and near real-time processing
  • Incur minimum additional cost
  • Simple to implement and maintain

Cosmos DB Change Feed

Cosmos DB Change Feed listens to Cosmos DB containers for changes and outputs the list of items that were changed in the chronological order of their modification. Cosmos DB Change Feed enables building efficient and scalable solutions for the following use cases:

  • Triggering a notification or calling an API
  • Real-time stream processing
  • Downstream data movement or archiving

AzureCosmosDBChangeFeedOverview

Types of operations

  • Change feed tracks inserts and updates. Deletes are not tracked yet
  • Cannot control change feed to track only one kind of operation, for example only inserts
  • For tracking deletes in the Change Feed, workaround is to soft-delete and assign a small TTL (Time To Live) value of “n” to automatically delete the item after “n” seconds
  • Change Feed can be read for historic items, as long as the items have not been deleted
  • Change Feed items are available in order of their modification time (_ts system attribute), per logical partition key, and tagged with the same _lsn (system attribute) value for all items modified in the same transaction

Read more about Azure Cosmos DB Change Feed from Microsoft docs to gain a thorough understanding. Change Feed can be processed using Azure Functions or Change Feed Processor Library. In this article, we will use Azure Functions.

Azure Functions

Azure Functions is an event-driven, serverless compute platform for easily running small pieces of code in Azure. Key points to note are:

  • Write specific code for a problem without worrying about an application or the infrastructure to run it
  • Use either C#, F#, Node.js, Java, or PHP for coding
  • Pay only for the time your code runs and trust Azure to scale
  • As of July 2019, the Azure Functions trigger for Cosmos DB is supported for use with the Core (SQL) API only

Read more from Microsoft docs to understand full capabilities of Azure Functions.

If you use Consumption plan pricing, it includes a monthly free grant of 1 million requests and 400,000 GBs of resource consumption per month per subscription in pay-as-you-go pricing across all function apps in that subscription, as per MS docs.

Compare hosting plans and check out pricing details for Azure Functions at the Functions pricing page to gain a thorough understanding of pricing options.

Real-time data movement using Change Feed and Azure Functions

The following architecture will allow us to listen to a Cosmos DB container for inserts and updates, and copy changes to a SQL Server Table. Note that Change Feed is enabled by default for all Cosmos DB containers.

I will create a Cosmos DB container and add an Azure Function to listen to the Cosmos DB container. I will then modify the Azure Function code to parse modified container items and save them to a SQL Server table.

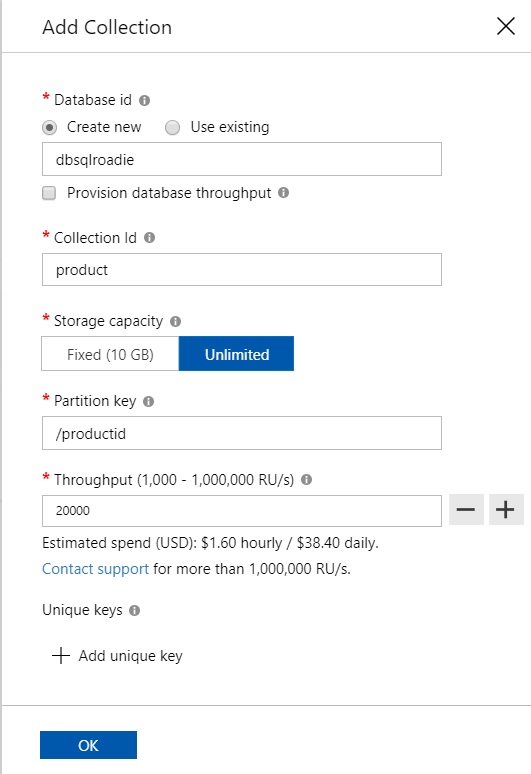
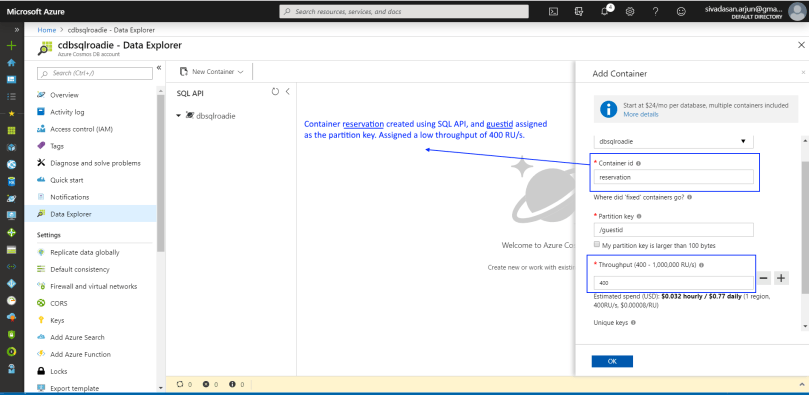
1. First, I navigated to Azure portal, Cosmos DB blade and created a container called reservation in my Cosmos DB database. As it is purely for the purposes of this demo, I assigned lowest throughput of 400 RU/s

01_ContainerCreation02_ContainerCreated


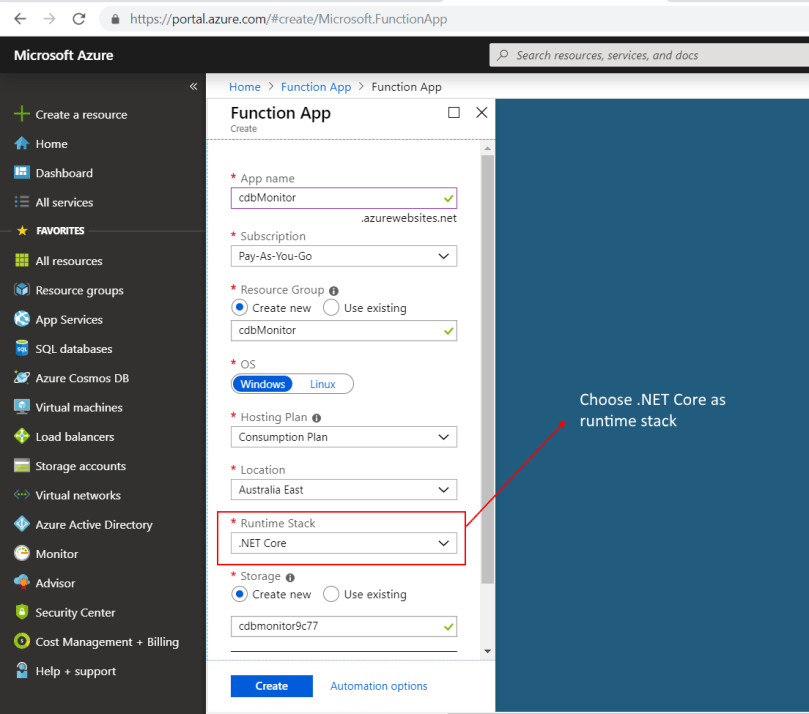
2. Now that the container is ready, proceed to create an Azure Function App. The Azure Function will be hosted in the Azure Function app

03_AddFunctionApp.png

04_AddFunctionApp.png


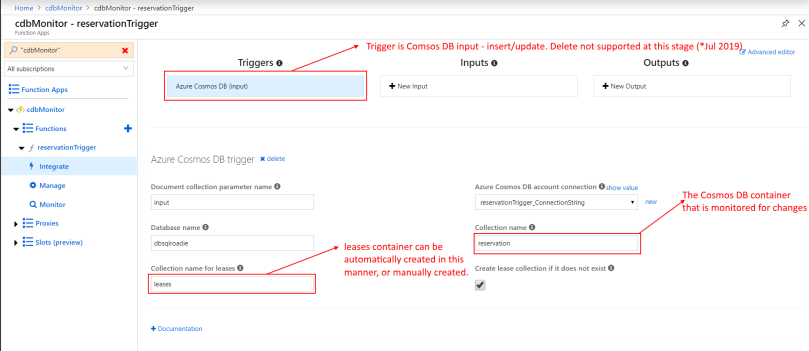
3. Add an Azure Function within the newly created Azure Function App. Azure Function trigger for Cosmos DB utilizes the scaling and event-detection functionalities of Change Feed processor, to allow creation of small reactive Azure Functions that will be triggered on each new input to the Cosmos DB container.

055_AzureFunction.png

05_FunctionAppCreated.png

06_AddAzureFunction


4. Configure the trigger. Leases container may be manually created. Alternately, check the box that says “Create lease collection if it does not exist”. Please note that you would incur cost for storage and compute for leases container.

07_AzureFunctionConfig

I got this error that read – “The binding type(s) ‘cosmosDBTrigger’ are not registered. You just need to install the relevant extension. I saw many posts about this, so it will most likely be fixed soon.

08_AzureFunctionBindingError.png

Sort out the error by installing the extension for Azure Cosmos DB trigger.

09_AzureCosmosDBTriggerExtensionInstall


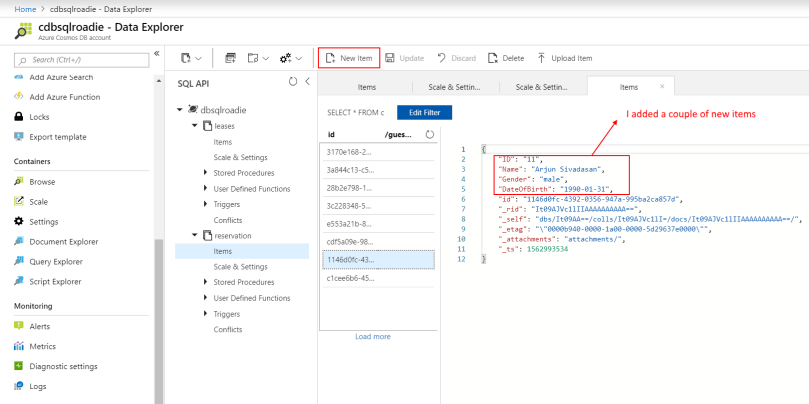
5. Once the function is up and running, add an item to the reservations container that we are monitoring. And we have a working solution!

10_CosmosDBContainer_AddEntries11_AzureFunctionRunning


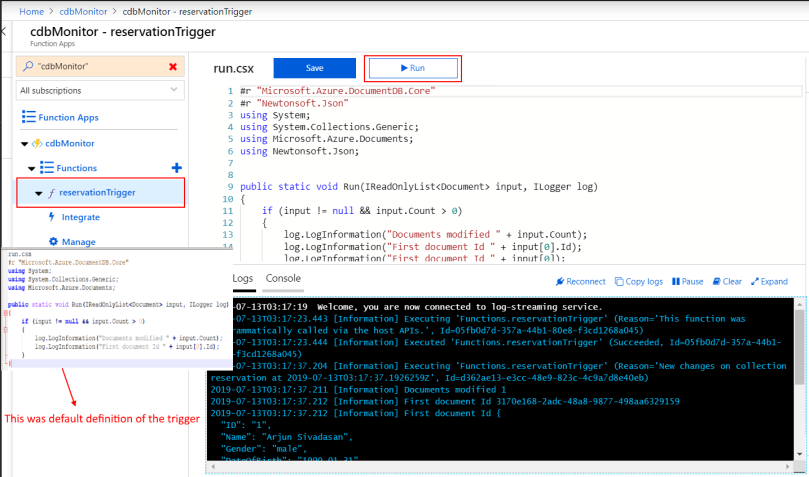
6. Trigger definition may be modified to achieve different things, in our case we will parse the feed output and persist changes to SQL server. You can download the csx file I used.

12_AzureFunctionDefinitionModify.png

13_AzureCosmosDBContainer_ModifyItem14_AzureFunction_SavingToDatabase15_SavedInDatabase

Summary

We have successfully implemented a serverless, event-based low cost architecture that is built to scale. Bear in mind that you would still end up paying for Azure Function and the underlying leases collection, but there will be minimum additional RU cost incurred from reading your monitored container(s) as you are tapping into the Change Feed.

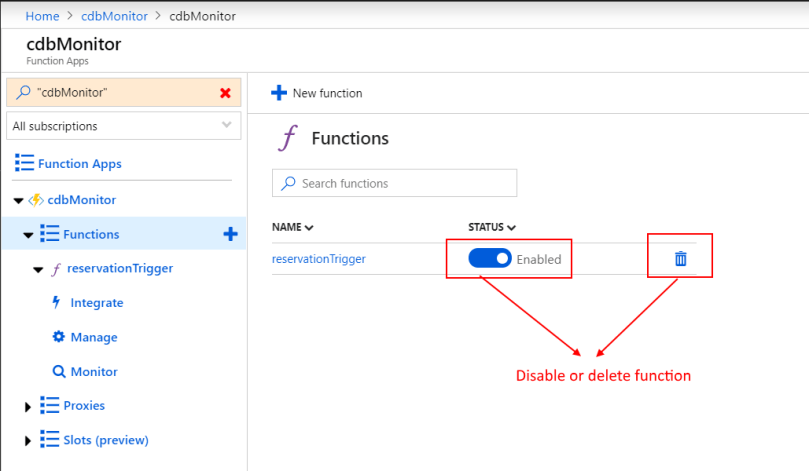
You can monitor the function and troubleshoot errors.

17_Funcion_Control20_Monitor_AzureFunction

I hope you found the article useful. Add a comment if you have feedback for me. If you have any question, drop me a line on LinkedIn. I’ll be happy to help 🙂 Happy coding!

Resources:

https://docs.microsoft.com/en-us/azure/cosmos-db/change-feed
https://docs.microsoft.com/en-us/azure/cosmos-db/changefeed-ecommerce-solution
https://azure.microsoft.com/en-au/services/functions/
https://docs.microsoft.com/en-us/azure/azure-functions/functions-overview
https://docs.microsoft.com/en-us/azure/azure-functions/functions-bindings-cosmosdb-v2
https://docs.microsoft.com/en-us/azure/cosmos-db/change-feed-functions
https://azure.microsoft.com/en-au/resources/videos/azure-cosmosdb-change-feed/
https://h-savran.blogspot.com/2019/03/introduction-to-change-feed-in-cosmos.html

Analyzing Heart Disease risk using Key Influencers AI visual in Power BI

The Gartner Magic Quadrant for 2019, announced earlier this month, names Microsoft the leader in Analytics and Business Intelligence Platforms. Microsoft also coincidentally announced the public preview release of its first AI-driven visual for Power BI Key Influencers – this month, among a number of new features for Feb 2019. Inbuilt integration of Power BI with many Azure data products would catapult Power BI miles ahead of Tableau in the long run.

EN-CNTNT-GartnerMQ-BI2019.jpg

Key Influencers is the first of many AI visuals Microsoft would release I assume, in their efforts to democratize AI and make their customers look cool 🙂 In this article, we will go over the various features of this new visual using a publicly available dataset, and get familiar with interpreting the results. Download a copy of Power BI Desktop file for the example I am using in this article and try it out yourself using the free Power BI Desktop tool.

Key Influencers

Key Influencers is a powerful Power BI visual that lets us understand the factors that drive a metric. Power BI analyzes data, ranks the factors that matter, and displays them as key influencers. Under the hood, Power BI uses ML.NET to run logistic regression to calculate the key influencers. Logistic regression is a statistical model that compares different groups to each other, also taking into consideration the number of data points available for a factor.

As the visual is still in preview, there are a number of limitations. My first attempt to use Key Influencers using a survey responses dataset was rather unimpressive.

In my second attempt, I used the popular Heart Disease dataset from UCI to identify key influencers affecting heart disease, and achieved good results.

Heart Disease - Key Influencers Power BI.jpg

Limitations

Before we delve any further, let us take a look at the limitations that apply in the public preview phase of the visual. Pay attention here to avoid frustration as you explore the visual.

Following features are not supported:

  • Analyzing metrics that are aggregates/measures
  • Direct Query / Live Connection / Row Level Security – support
  • Consuming the visual in Power BI Embedded and Power BI mobile apps

Using the Key Influencers Visual

As a first time user, I found the Key Influencers visual intuitive and self-explanatory. It hardly takes a few minutes to set up the visual once you have clean data. Check out Microsoft documentation to understand all aspects of the visual. You could also download a copy of Power BI Desktop file for the example I am using in this article.

Note: Keep column names readable as this will help interpret the visual better

Getting Familiar

There are 2 tabs available within the visual – Key influencers and Top Segments.

The Key influencers tab displays the key factors affecting the metric value selected. In this case, the top factor that affects positive diagnosis of Heart Disease, based on our dataset, is Reversible Defect Thalassemia – increasing the risk of heart disease by 2.83 times when the value of Reversible Defect Thalassemia is 7.

On the right hand side, there is a column chart showing distribution of the selected factor. The check box at the bottom lets you display only influential factor values. We could click-select a different factor to see how it contributes to heart disease.

Heart Disease - Key Influencers Power BI - Getting Familiar.jpg


The Top segments tab displays different segments identified by Power BI within the population, for the metric value selected. Click-select a segment to view more details such as the factor values that define the segment, and how the segment compares against the average. We could also drill down further into the segment to split by additional fields.

Under the hood, Power BI uses ML.NET to run a decision tree to find interesting subgroups. The objective of the decision tree is to end up with a subgroup of datapoints that is relatively high in the metric we are interested in – in our case, the patients who  are suspected to have heart disease.

Heart Disease - Key Influencers Power BI - Top Segment.jpg


Heart Disease - Key Influencers Power BI - Top Segment Details.jpg

First Impression

Considering that it is still in preview and is only going to get better, Key Influencers ticks the right boxes. The rationale behind choosing a popular dataset, such as the Heart Disease dataset from UCI, for my example was to allow for comparison of results to Machine Learning models that are already publicly available. Power BI seems to identify influencers correctly and does a good job at presentation. I’m thoroughly impressed by this new feature.

Suggested Reading

If you enjoyed this article, consider reading my other articles on Azure data products.

https://sqlroadie.wordpress.com/2018/04/29/what-is-azure-cosmos-db/
https://sqlroadie.wordpress.com/2018/08/05/azure-cosmos-db-partition-and-throughput/
https://sqlroadie.wordpress.com/2019/02/17/azure-databricks-introduction-free-trial/

Resources:

Download the Power BI workbook used in the example – https://drive.google.com/open?id=13Pt25UPt7dOW3raZmavHHVl7gAStv5uy
Intro to Key Influencers by Microsoft: https://docs.microsoft.com/en-us/power-bi/visuals/power-bi-visualization-influencers
Power BI Feb 2019 feature summary – https://powerbi.microsoft.com/en-us/blog/power-bi-desktop-february-2019-feature-summary/

Heart Disease Data source
Donor:  David W. Aha (aha ‘@’ ics.uci.edu) (714) 856-8779
Creators:

  • Hungarian Institute of Cardiology. Budapest: Andras Janosi, M.D.
  • University Hospital, Zurich, Switzerland: William Steinbrunn, M.D.
  • University Hospital, Basel, Switzerland: Matthias Pfisterer, M.D.
  • V.A. Medical Center, Long Beach and Cleveland Clinic Foundation: Robert Detrano, M.D., Ph.D.

Azure Databricks – Introduction (Free Trial)

Microsoft’s Azure Databricks is an advanced Apache Spark platform that brings data and business teams together. In this introductory article, we will look at what the use cases for Azure Databricks are, and how it really manages to bring technology and business teams together.

Databricks

Before we delve deeper into Databricks, it is good to have a general understanding of Apache Spark.

Apache Spark is an open-source, unified analytics engine for big data processing, maintained by the Apache Software Foundation. Spark and its RDDs were developed in 2012 in response to limitations of MapReduce

Key factors that make Spark ideal for big data processing are:

  • Speed – up to 100X faster
  • Ease of use – code in Java, Scala, Python, R and SQL
  • Generality – use SQL, streaming and complex analytics
Apache Spark Ecosystem.jpg
Pic courtesy: Microsoft

Databricks – the company – was founded by creators of Apache Spark. Databricks provides a web-based platform for working with Spark, with automated cluster management and IPython-style notebooks. It is aimed at unifying data science and engineering across the Machine Learning (ML) life cycle from data preparation, to experimentation and deployment of ML applications. Databricks, by virtue of its big data processing capabilities, also facilitates big data analytics. Databricks, as the name implies, thus lets you build solutions using bricks of data.

Azure Databricks

Azure Databricks combines Databricks and Azure to allow easy set up of streamlined workflows and an interactive work space that lets data teams and business collaborate. If you’ve been following data products on Azure, you’d be nodding your head along, imagining where Microsoft is going with this 🙂

Azure Databricks enables integration across a variety of Azure data stores and services such as Azure SQL Data Warehouse, Azure Cosmos DB, Azure Data Lake Store, Azure Blob storage, and Azure Event Hub. Add rich integration with Power BI, and you have a complete solution.

Azure Databricks Overview
Pic courtesy: Microsoft

Why use Azure Databricks?

By now, we understand that Azure Databricks is an Apache Spark-based analytics platform that has big data processing capabilities and brings data and business teams together. How exactly does it do that, and why would someone use Azure Databricks?

  1. Fully managed Apache Spark clusters: With the serverless option, create clusters easily without having to set up your own data infrastructure. Dynamically auto-scale clusters up and down, and auto-terminate inactive clusters after a predefined period of inactivity. Share clusters with your teams, reduce time spent on infrastructure management and improve iteration time.

  2. Interactive workspace: Streamline data processing using secure workspaces, assign relevant permissions to different teams. Mix languages within a notebook – use your favorite out of R, Python, Scala and SQL. Explore, model and execute data-driven applications by letting Data Engineers prepare and load data, Data Scientists build models, and business teams analyze results. Visualize data in a few clicks using familiar tools like Matplotlib, ggplot or take advantage of the rich integration with Power BI.

  3. Enterprise security: Use SSO through Azure Active Directory integration to run complete Azure-based solutions. Roles-based access control enables fine-grained user permissions for notebooks, clusters, jobs, and data.

  4. Schedule notebook execution: Build, train and deploy AI models at scale using GPU-enabled clusters. Schedule notebooks as jobs, using runtime for ML that comes preinstalled and preconfigured with deep learning frameworks and libraries such as TensorFlow and Keras. Monitor job performance and stay on top of your game.

  5. Scale seamlessly: Target any amount of data or any project size using a comprehensive set of analytics technologies including SQL, Streaming, MLlib and GraphX. Configure number of threads, select number of cores and enable autoscaling to dynamically scale processing capabilities leveraging a Spark engine that is faster and performant through various optimizations at the I/O layer and processing layer (Databricks I/O).

Of course, all of this comes at a price. If this article has piqued your interest, hop over to Azure Databricks homepage and avail the 14 day free trial!

Azure Databricks - Free Trial 14 days.jpg

Suggested learning path:

  1. Read more about Azure Databricks – https://docs.microsoft.com/en-us/azure/azure-databricks/what-is-azure-databricks
  2. Create a Spark cluster and run a Spark job on Azure Databricks – https://docs.microsoft.com/en-us/azure/azure-databricks/quickstart-create-databricks-workspace-portal#clean-up-resources
  3. ETL using Azure Databricks – https://docs.microsoft.com/en-us/azure/azure-databricks/databricks-extract-load-sql-data-warehouse
  4. Stream data into Azure Databricks using Event Hubs – https://docs.microsoft.com/en-us/azure/azure-databricks/databricks-stream-from-eventhubs
  5. Sentiment analysis on streaming data using Azure Databricks – https://docs.microsoft.com/en-us/azure/azure-databricks/databricks-sentiment-analysis-cognitive-services

I hope you found the article useful. Share your learning experience with me. My next article will be on Real-time analytics using Azure Databricks.

Azure Databricks - Real time analytics.jpg
Azure Databricks

Resources:

https://azure.microsoft.com/en-au/services/databricks/
https://databricks.com/product/azure
https://docs.microsoft.com/en-us/azure/azure-databricks/what-is-azure-databricks
https://docs.microsoft.com/en-us/azure/azure-databricks/quickstart-create-databricks-workspace-portal#clean-up-resources
https://databricks.com/blog/2019/02/07/high-performance-modern-data-warehousing-with-azure-databricks-and-azure-sql-dw.html

Global AI Bootcamp – Developing AI, responsibly

Global AI Bootcamp, Brisbane 2018

Yesterday, I attended the Global AI Bootcamp Brisbane (at the Precinct, Valley) along with nearly 100 other technology enthusiasts. The event was well organized by David Alzamendi of Wardy IT Solutions and Thiago Passos of SSW Consulting. I rocked up to the event hoping to get an update on the rapidly evolving Data Platform offerings from Microsoft. While the event did meet most of my expectations, it planted one particular seed of thought in my head. As I walked away at end of the day, I was enthralled about the rigorous, almost paranoic, awareness and research of the social responsibility that AI developers and solution providers should exert.

IMG_20181215_093303

Role of Ethics in AI

The event started with playback of the recorded keynote address by distinguished researchers of Microsoft AI. It was probably the small shot of long black coffee I had just had, I sat there wide-eyed and amazed by the wise words of Hanna Wallach, Principal Researcher at Microsoft Research, NYC. Hanna’s research covers a broad range of topics; she was clearly passionate about the impact of AI on society – FATE (Fairness, Accountability, Transparency and Ethics in AI). I had never thought about ethics in AI the same way, but it made perfect sense.

The one reaction that the average Joe has to AI is the notion that it is almost magical, but always reliable and authentic. That’s a dangerous prejudice! AI, much like any other branch of science, can be used for good or bad. The elevated status that AI enjoys amongst the masses, thanks to Hollywood movies, and research companies pitching AI as the field of science that would shape 21st century, leads to the belief that AI = TRUTH! Those in the know, are aware that inherent biases in training data sets lead to biases in scoring. My heart skips a beat just to think how a technologically illiterate person may be led to believe utter lies, much like the predictions of this highly controversial Israeli company – Faception. They claim to be able to apply facial personality analytics technology to predict a person’s IQ, their personality – whether they are an academic researcher or a terrorist, for instance, just by looking at their face.

Utilizing advanced machine learning techniques we developed and continue to evolve an array of classifiers. These classifiers represent a certain persona, with a unique personality type, a collection of personality traits or behaviors. Our algorithms can score an individual according to their fit to these classifiers (sic).

When Vanessa Love, Assistant Director of Integration and DevOps at Australian Bureau of Statistics, talked about Faception during her session – I ain’t afraid of no terminator – at the Bootcamp, my initial impression was that the company was called out on its claims and was obviously identified as a scam. I could resonate with her frustration and anger as she went on to explain how Faception was working with governments, and clients in Fintech and Retail. There are numerous such shocking applications of AI. For instance, Stanford researchers built an AI solution that could predict a person’s sexuality from facial analysis. The only aspect that is more appalling than the intent of their research is the fact that the average Joe doesn’t read the T&Cs – in this case, their model was correct only 81% and 71% of the times in predictions for males and females respectively. So, what about the 48 wrong predictions for every 152 correct predictions? Vanessa also mentioned Amazon’s AI enabled recruiting tool that was stood down due to racial and sexist biases. In this case, AI helped to reveal the truth about inherent historical bias in recruitment practices at one of the biggest technology companies. So, sometimes AI = TRUTH. Tricky? Food for thought!

Will AI enslave human beings?

The age-old question! This is a recurring question I am asked when I discuss AI with less technologically-literate acquaintances. I usually go on to explain how Machine Learning works, and the differences between Supervised and Unsupervised learning. The key point I try to drive home is that AI is not a person or a thing, and more importantly, like all software solutions, it is error prone and not to be taken for granted. When we do take technology for granted, self-driving cars kill people and auto-pilot programs crash planes. Technology is meant to aid and assist, not render humanity obsolete!

Developing AI, responsibly

Luckily, researchers like Hanna Wallach and Yoshua Bengio are actively working on building a code of conduct for AI research and application. A result of that vigil is the Montreal Declaration for Responsible Development of Artificial Intelligence, inked earlier this month. At the time, I read about it and quickly slid that thought to the slow sectors of my brain. I signed the declaration a little while ago. As a technologist, I not only have the responsibility to develop AI responsibly, but also educate others about the pros and cons of  AI solutions.

Other interesting learnings from the Bootcamp

Jernej Kavka, Software Architect at SSW Consulting, presented his experiments with Real-Time Face Recognition using Microsoft Cognitive Services. He explained how his team successfully reduced costs by 99% by applying caching and pre-processing. I found his session remarkable.

Joseph Zhou, Data Scientist and Solution Development Consultant at Avanade – talked about drag-and-drop AI using Azure Machine Learning Services. I found his session crisp and relevant. Later, Yousry Mohamed, Consultant at Readify, explained how to apply DevOps practices in Azure Machine Learning and automating model-selection using “a bit of simple code”. As always, Yousry’s presentation was animated and wonderful.

A day well spent!

Overall, it was a day well spent. Thanks to all sponsors and volunteers for making the event happen! I could tell everyone was excited to be there, and we all went home with various thoughts in our little heads, a little wiser than we were at start of the day. The thought in my head was – what about the Tesla driver who relied on the self-driving capability, what about the black Facebook employee who the soap dispenser denied, what happens when AI goes wrong?

Azure Cosmos DB Free Trial – walk through of Gremlin API for Graph

After the 2018 Microsoft Ignite event, Microsoft announced a free trial of Azure Cosmos DB. For those who are eager to check out Cosmos DB, this is a great opportunity to familiarize yourself with the hottest No SQL database in the market. Cosmos DB is currently sitting pretty at Rank 29 in the DB Engines Ranking page. Quite an achievement considering that the product is “only 1 year old”.

MS recently went public with the support for Cassandra API. A few years from now, Cosmos DB will be the most popular database offering from Microsoft. If you want to get a gentle intro to Cosmos DB, check out my previous posts – Introduction to Azure Cosmos DB and Azure Cosmos DB – Partition and Throughput.

This article is a walk through of using the Free Trial to get started with Cosmos DB.

Limited Time Free Trialhttps://azure.microsoft.com/en-au/try/cosmosdb/

There is no need for a credit card or subscription to avail this free trial. Please do note though that MS is likely to withdraw trial in a few months.

Step 1: Choosing an API/data model
Once you click the above URL, you will be asked to pick an API and data model. Go ahead and pick SQL to check out document (JSON) data model if you are unsure. I want to check out Gremlin API for Graph, so I am choosing Graph in this example.
You will be asked to login with your Microsoft account. If you don’t have one, create a new account.

CosmosDB Trial

Step 2: Choose default options and click on Create container.
Note that container will be created free of cost at a low throughput of 400 RU/s. If you are not familiar with throughput, read my article about Azure Cosmos DB – Partition and Throughput.
You now have a brand new container and the familiar Azure portal access. My trial container has read/write location of Central US.

Azure Portal Database

Closer look: There is a lot going on here, so let us take a closer look.
My container is called Persons and it is in graphdb database. Cosmos DB uses Apache Tinkerpop Gremlin API for graph traversal. Currently, my container Persons is empty, so let us connect a sample application. If you are new to Graph DB, I recommend reading this free ebook from another popular Graph DB product – Neo4j.
https://neo4j.com/graph-databases-book/

Graph DB - Persons

Step 3: Sample project
Click on the Quick start blade to download a sample project and explore graph data.
The sample project already has the connection string set to the trial database, so we can execute the project right away. How awesome is that!

Quickstart

In Step 1, I chose Graph API and model, so my sample project has Gremlin API queries. Read more about Gremlin API here – https://aka.ms/gremlin.

Gremlin API Queries

Step 4: Execute sample project
Now it’s time to execute the project!

Sample Program Execution

Step 5: Data Explorer
Looks like the program has added a number of graph documents to the container. Let us head over to Azure Portal and explore using Data Explorer blade. Click on the Execute Gremlin Query button to take a look at the data added by sample program. Now let us take a closer look at the output.

Graph DB Data Explorer.jpg

Closer look: A quick look shows that the query g.V() returned 4 nodes. Result can be viewed in either JSON or Graph mode.

Output - closer look 1

If we click on the second node – Ben – and zoom in, we get a nice graphical view of ben’s relationships. Click and explore to view related nodes.

Output - closer look 3

Switch to JSON mode to view result in JSON format. Pretty self-explanatory there 🙂

Output - closer look 2

Step 6: Monitor activity
Head over to Activity Log blade to take a look at activity in the Cosmos DB account. This could be downloaded as a .csv or exported to Event Hub for further analysis.

Activity Log

Summary

We took a look at the Cosmos DB Trial offered by Microsoft and got started with Graph API. Graph DB has a number of attractive use cases such as Fraud Detection and Recommendation Engine. Another popular Graph DB is Neo4j. I hope this article helped you understand how powerful Cosmos DB’s multi model support is. If you have any questions, drop me an email or add a comment. I will be happy to help. Add me on LinkedIn to stay connected – https://www.linkedin.com/in/arjunsivadasan/

Further Reading

  1. Introduction to Azure Cosmos DB and Azure Cosmos DB – Partition and Throughput
  2. Intro to Cassandra API in Cosmos DB – https://docs.microsoft.com/en-us/azure/cosmos-db/cassandra-introduction
  3. Intro to Graph DB – https://neo4j.com/graph-databases-book/
  4. Explore Gremlin API – https://aka.ms/gremlin
  5. Cosmos DB playground – https://www.documentdb.com/sql/demo
  6. Microsoft Ignite 2018 Updates – https://news.microsoft.com/uploads/prod/sites/507/2018/09/IGNITEBOOKOFNEWS-5ba95469d658b.pdf

Azure Cosmos DB – Partition and Throughput

In my previous article Introduction to Azure Cosmos DB, I mentioned Partition and Throughput only briefly. Adopting a good partition scheme is quintessential to setting up your Cosmos DB container for elastic scaling and blazing performance. This article will take a closer look at these two aspects to help fully utilize the storage and performance offerings of Cosmos DB.

Partition

Azure Cosmos DB containers store documents, graphs or tables. Containers (a.k.a. collections in the context of documents) are logical entities that could be distributed across multiple physical partitions or servers.

Physical and Logical Partitions

A physical partition is an internal Cosmos DB concept, essentially a fixed amount of SSD storage combined with a variable amount of compute power (CPU, memory and IO). The number of physical partitions of a container depends on its storage and throughput. For containers with shared throughput, number of partitions depends on RU/s assigned to the set of containers.

Request Unit (RU/s) – is the unit of throughput. 1 RU/s serves a get by self-link (internal property) or id of a 1 KB item.

When a collection is created, we can specify a fixed storage capacity of 10 GB or unlimited capacity. A fixed storage collection is limited in performance to a max of 10,000 RU/s. If we choose unlimited capacity, the collection created potentially has no max RU/s limit. Collections are supposedly unlimited in terms of storage and throughput, and physical partition management is handled by Cosmos DB behind the curtains. Note that for a multi-partition collection, we need to specify a partition key.

CosmosDB Container - Partitions

Data within a container having the same partition key value form a logical partition. The max storage limit of a logical partition is 10 GB, which means if data associated with a certain partition key value goes beyond 10 GB, the logical partition will be full and cannot grow any further. This is why adopting a good partition scheme is very important to avail the storage and performance guarantees of Azure Cosmos DB.

Partitioning example

Azure Cosmos DB internally has a limit for the max throughput that can be provided by a physical partition – PRUmax. This value keeps changing based on factors such as hardware used and platform upgrades. For now, keep in mind that this happens behind the scenes.

Let us assume PRUmax = 10,000 RU/s. We create an unlimited Collection product at 20,000 RU/s initial throughput and productid as the partition key. Cosmos DB has to create at least 2 physical partitions to support the 20,000 RU/s throughput requested. Currently, the default seems to be 5. So, Cosmos DB creates a new collection with 5 physical partitions. The throughput requested will be equally assigned to these physical partitions. This means, the max throughput limit for each partition is 20,000/5 = 4000 RU/s.

Partitioning-Example-Product collection

As we add new documents, Cosmos DB allocates the key space of partition key hashes evenly and consistently across the 5 physical partitions. If the partition key is well chosen, writes will be distributed evenly across the partitions, each partition serving nearly 5000 RU/s and a cumulative of nearly 20,000 RU/s. This is ideal. In real world, it is possible that we chose a bad partition key.

What can go wrong?

  • Performance impact: If majority of the concurrent writes/reads pertain to a specific partition key value, we could have 1 physical partition maxing out the 5000 RU/s allocated to it (hot partition), while the other 4 partitions idling. When this happens, requests are bound to get rate-limited and we will get Http 429 response code.
  • Storage impact: Earlier in the article, I mentioned the concept of logical partition. All data having the same partition key form a logical partition. Logical partitions cannot be split across physical partitions. For the same reason, if the partition key chosen is of bad cardinality, we could potentially have skewed storage distribution. Say, 1 logical partition becomes fatter faster and hits the max limit of 10 GB, while the others are nearly empty. The physical partition housing the maxed out logical partition cannot split and could thus cause an application downtime.

Physical partition split

Azure Cosmos DB manages physical partitions seamlessly behind the scenes, if you chose your partition key smartly that is. Following are two scenarios when Cosmos DB will split a physical partition.

  • Storage limit of 10 GB: When a physical partition is full, Cosmos DB will split it into 2 new partitions assigning data corresponding to nearly half of the keys to each new partition. As mentioned previously, the split cannot happen if data in the physical partition in question have the same partition key value.
  • Increasing throughput: When throughput assigned is increased such that the existing number of physical partitions are insufficient to support it, Cosmos DB will add new physical partitions. In the above example, if the throughput is increased to 100,000 RU/s, Cosmos DB would add 5 new physical partitions.
    Cosmos DB needs 100,000/PRUmax = 10 physical partitions to support the throughput setting.

Throughput

What makes Cosmos DB an attractive high volume transaction database is the ease of scaling. When request rates are low, throughput could be lowered to keep costs down. Cosmos DB’s performance is predictable. For example, a read of a 1-KB document with session consistency always consumes 1 RU, regardless of number of concurrent requests or amount of data stored.

There are, however, two major design considerations to facilitate elastic scaling of Azure Cosmos DB.

Distribute requests and storage

Ideal candidate property for partition key will allow writes to be distributed across various distinct values. Requests to the same partition key should remain lower than the max throughput limit allocated to a partition. A good partition key will evenly distribute writes across all physical partitions and not cause hot partitions. In our example, productid is a good partition key, because it is unlikely that all concurrent requests will be focused on a specific product. If we were to chose the property productcategory as partition key, that could potentially cause hot partitions

Partition scope for queries and transactions

At one extreme, we can use the same partition key for all documents. At the other extreme, we can have unique partition key for each document. Both approaches have their limitations. Using the same partition key for all documents will limit scalability and cause a hot partition and inefficient utilization of throughput. Using unique partition keys will support high scalability, but result in a lot of cross-partition queries and prevent use of cross-document transactions. Occasional fan-out of queries is not too bad, but frequent fan-out will incur high RU consumption and result in rate-limiting.

Estimating throughput

Throughput can be estimated based on the number of expected reads/writes per second. 1 Request Unit (RU) corresponds to read of a 1-KB document containing 10 unique property values by self-link or id. Write, replace or delete will consume more RU/s.

RU calculator

Microsoft provides a Request Unit calculator that serves to arrive at a base throughput to assign when creating a new collection. Be prepared to fine tune the RU setting as you trot along, but this is a good starting point.

This URL ignites nostalgia 🙂

Request Unit Calculator
Pic courtesy: Microsoft

Conclusion

Azure Cosmos DB is a lot more versatile compared to the initial Document DB days. With added support for Mongo DB, Graph, Cassandra and Table APIs and multi-master and global distribution support, Cosmos DB is definitely the most exciting product in database technology at the moment. With the new Azure data products such as Azure Stream Analytics, Azure Data Bricks and HDInsight supporting out-of-the-box integration with Cosmos DB, it is fast becoming a good candidate for Big Data solutions.

Please feel free to reach out if you have questions. I’m always happy to discuss technology 🙂