Azure Cosmos DB – HTAP using Azure Synapse Link

I haven’t done much blogging in the last 6 months. My last article was posted in January, on Data Governance in the Covid era. After changing jobs in March, I prioritized getting settled into my new role. That said, I have had the writer’s itch for a while and thought what better topic to break the rut with than Cosmos DB. I am a big fan of Cosmos DB – Microsoft’s multi-model NoSQL database service in Azure, and I have written a few articles on the topic.

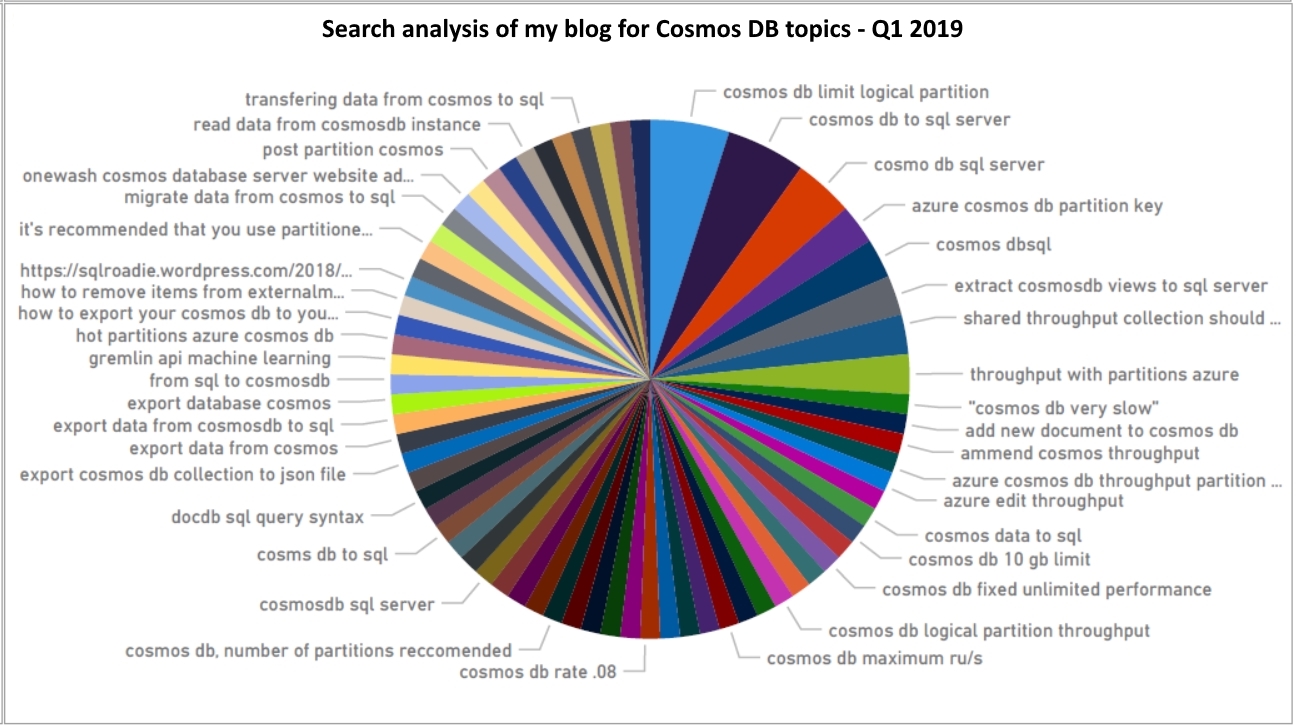
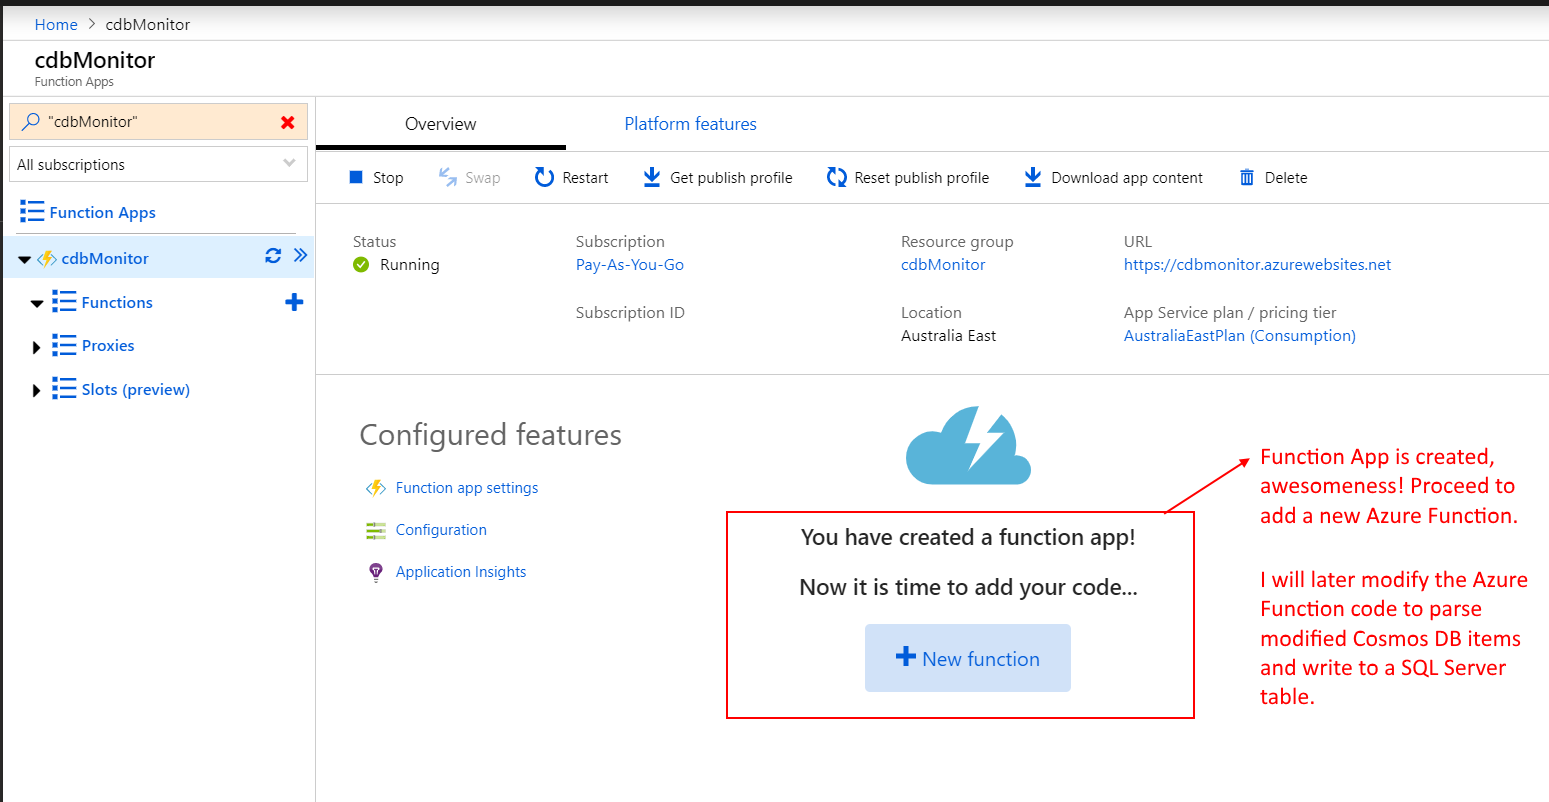
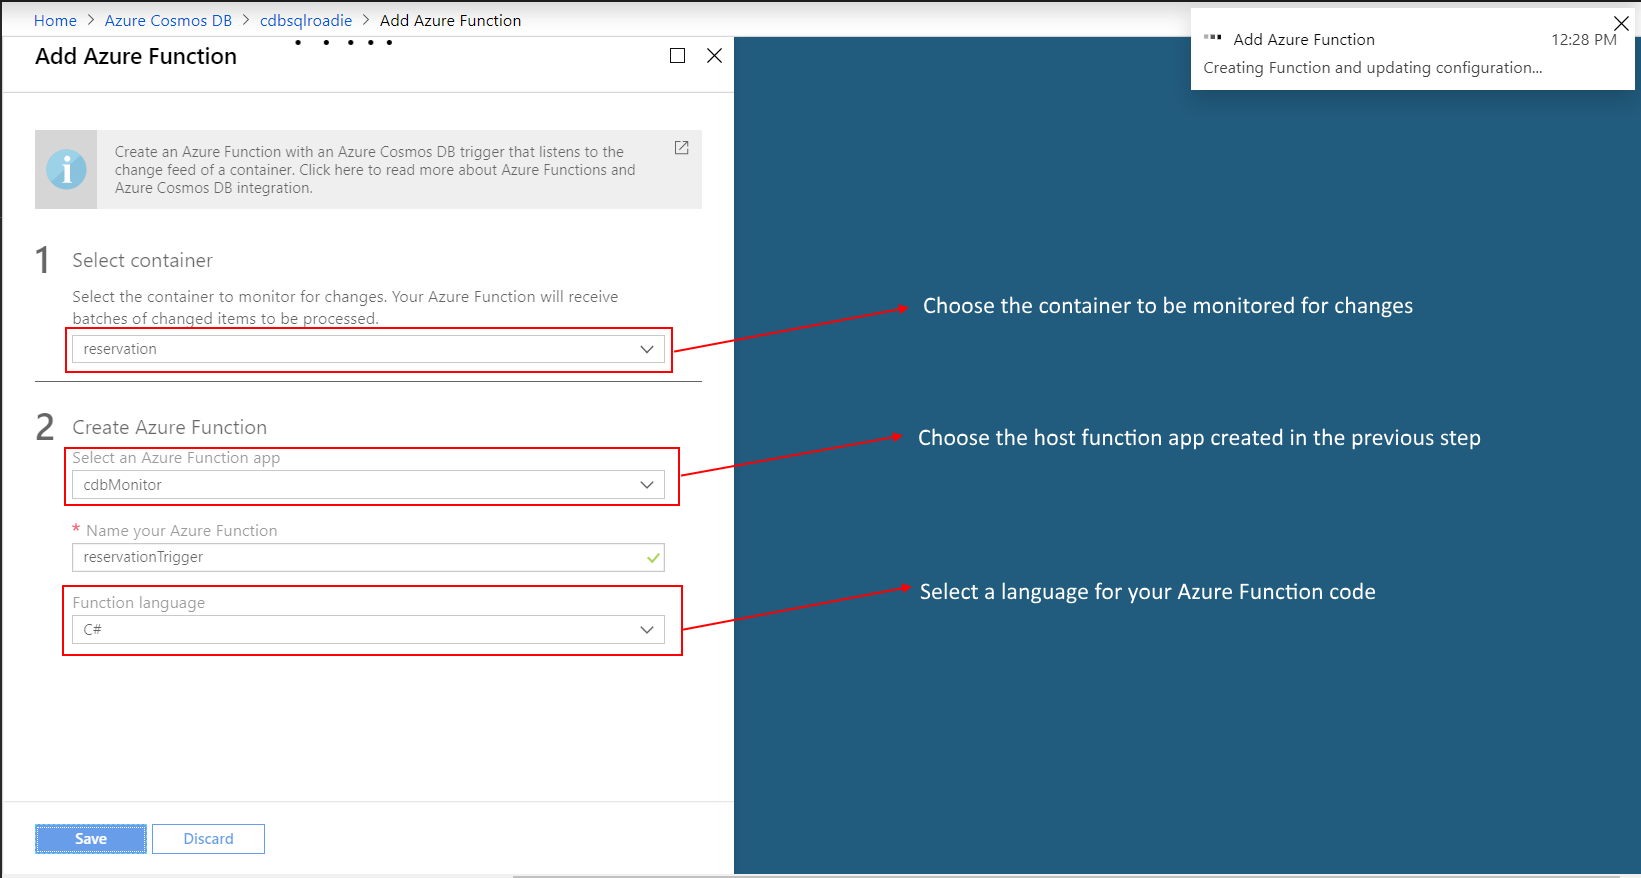
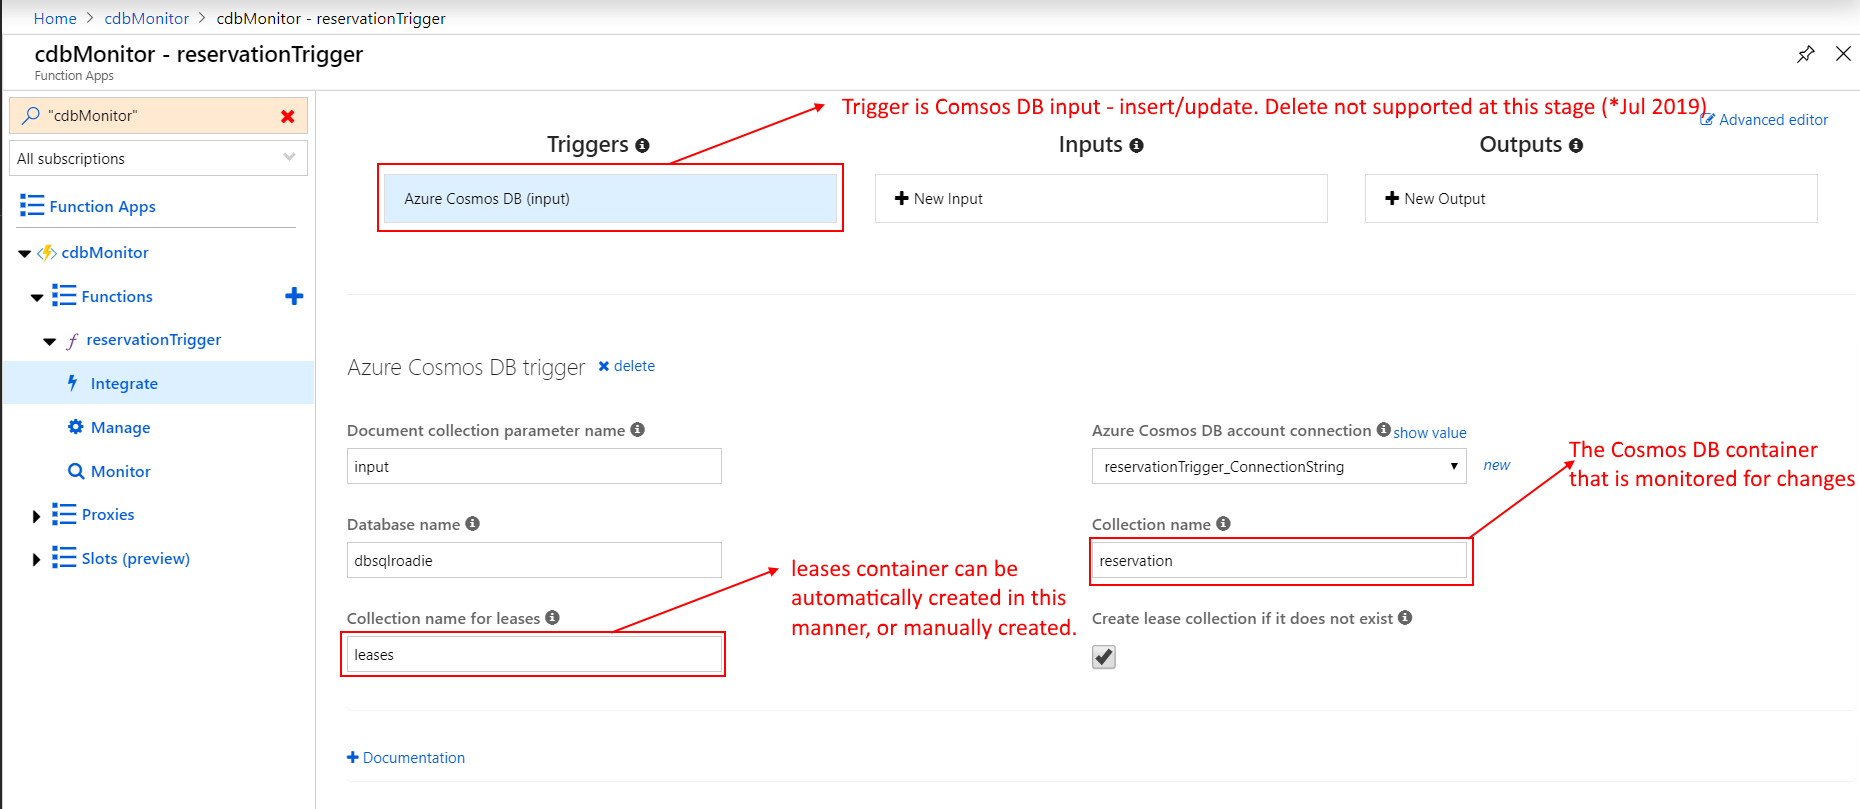
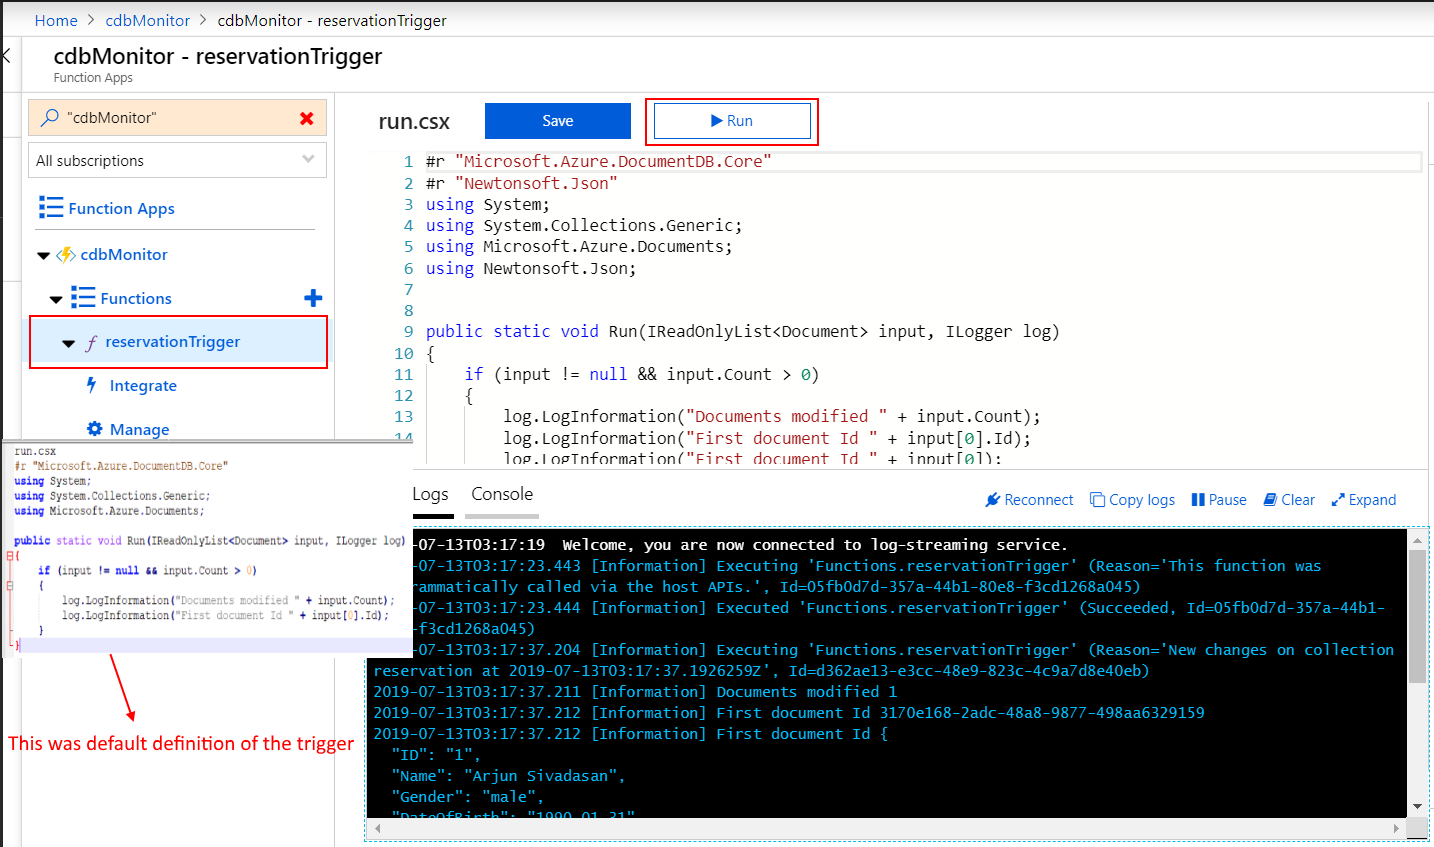
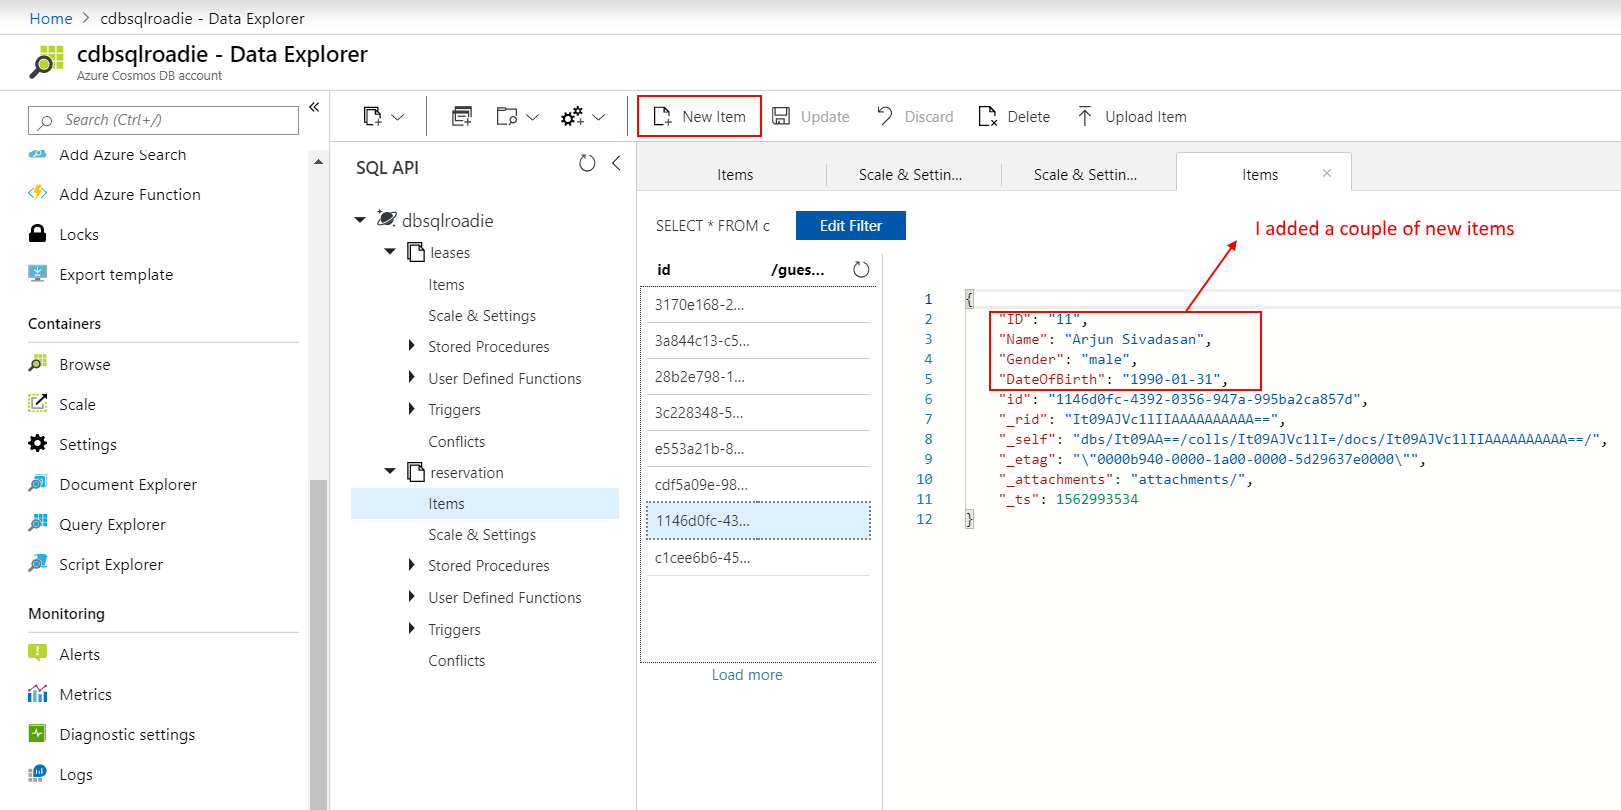
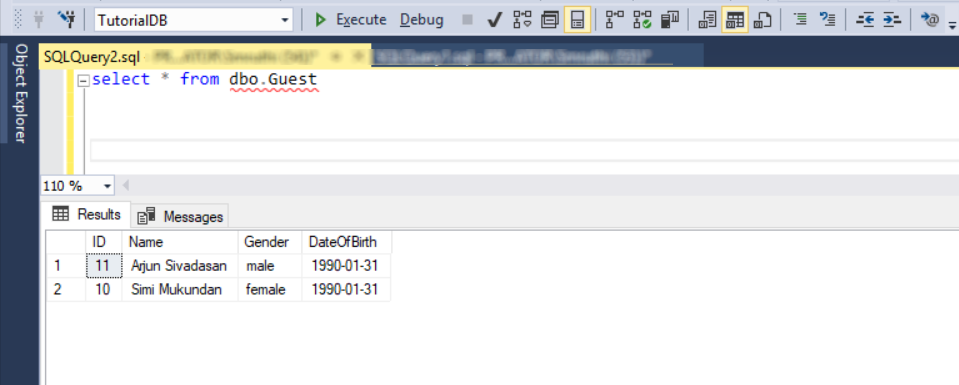
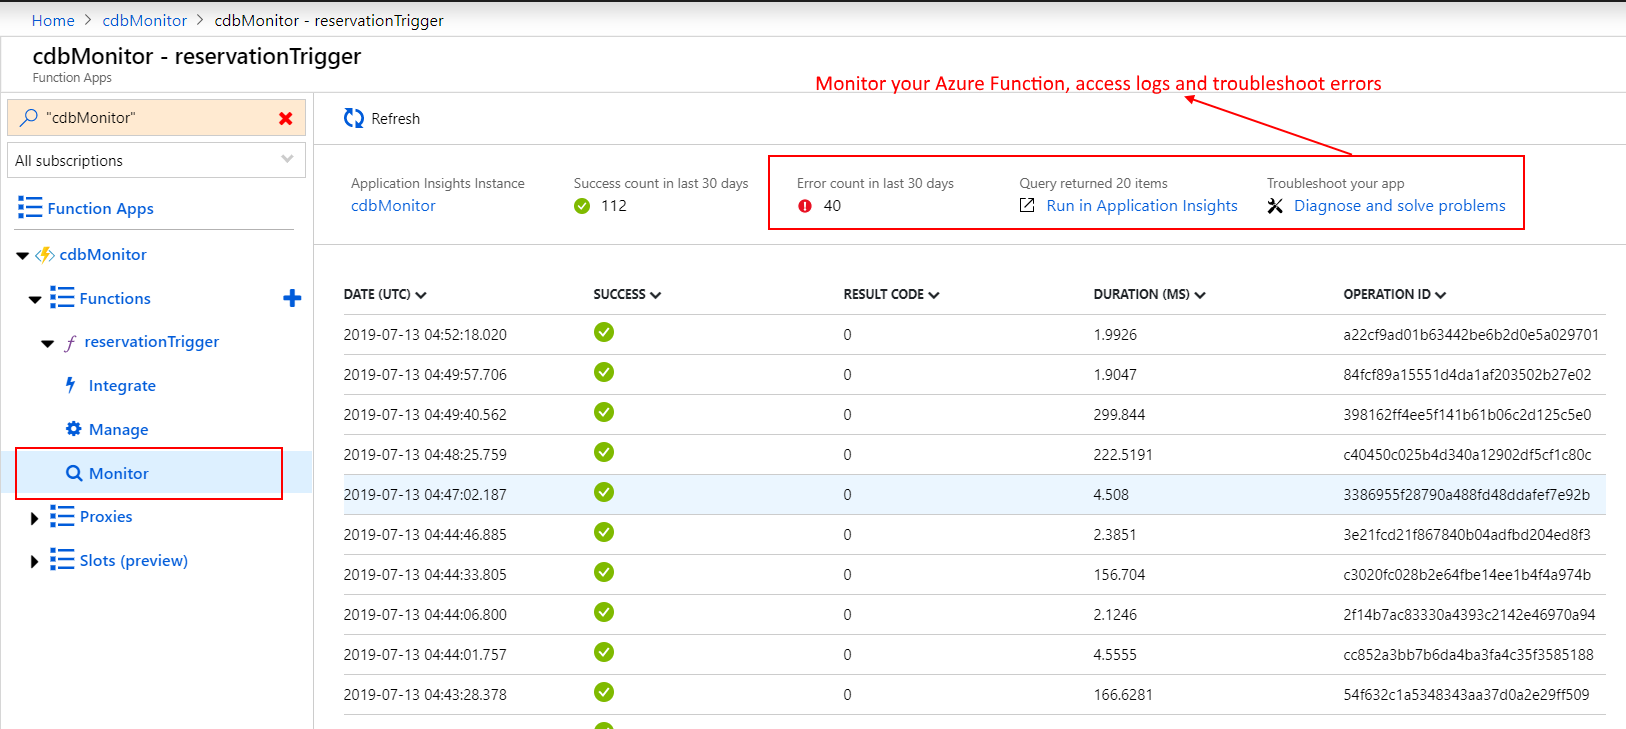
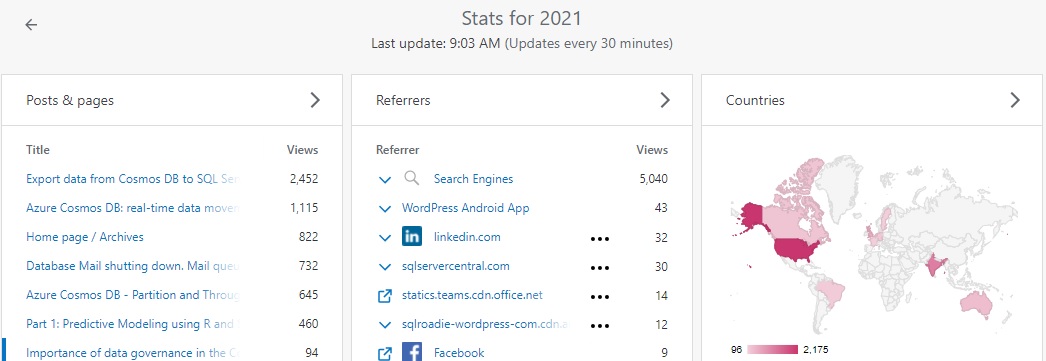
Recent stats of my blog show more interest in data movement out of Cosmos DB, possibly for reporting purposes. Check out my 2019 article on real-time data movement from Cosmos DB using Change Feed and Azure Functions, where I explained how to persist container changes to SQL Server. Well, that is one way to enable real-time analytics. Cosmos DB has evolved a lot since then, and there are new and smarter ways to achieve similar results. Last year (Dec 2020), Microsoft announced the general availability of Azure Synapse Analytics – the unified analytics service in Azure.

sqlroadie – 2021 blog stats

HTAP capabilities of Cosmos DB using Synapse Analytics

In this article, we will explore the HTAP capabilities of Cosmos DB. The goal is to derive real-time insights from transactional changes made to Cosmos DB, in a cost-effective manner with minimal overhead. I want the solution to be scalable, reliable and overall simple to maintain.

What is HTAP?

HTAP stands for hybrid transaction/analytical processing. Traditionally, data systems can be classified as either OLTP – Online Transaction Processing or OLAP – Online Analytical Processing. Amazon shopping website is a good example of an OLTP system, as it manages millions of customer orders daily in real-time. However, Amazon would have billions of historical customer order details in their OLAP data warehouse. This helps them to create product recommendations by analyzing historical order data, and serve it to the OLTP system through analytics APIs.

Ordinarily, transaction data has to be copied or replicated from OLTP -> OLAP databases through ETL processes, and reporting/insights/recommendations generated in the OLAP system at a latency that made business sense. This is a tedious process and involves a lot of overhead. Majority of enterprises still use this approach. However, advancements in computing have enabled a new age HTAP architecture.

Gartner defines HTAP as “a hybrid transaction/analytical processing (HTAP) architecture is best enabled by in-memory computing techniques and technologies to enable analytical processing on the same data store that is used to perform transaction processing. By removing the latency associated with moving data from operational databases to data warehouses and data marts for analytical processing, this architecture enables real-time analytics and situation awareness on live transaction data as opposed to after-the-fact analysis on stale data.

This is exciting stuff, and quite a game-changer in the world of databases. Enough said, how do we go ahead and design a solution using Cosmos DB’s HTAP capabilities!

Synapse Link for Cosmos DB

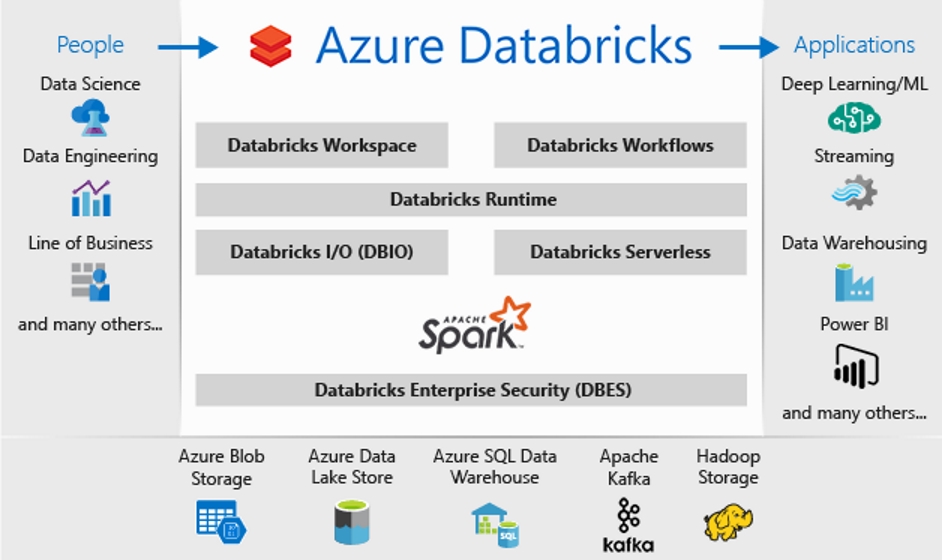
Synapse Link for Cosmos DB is a cloud-native HTAP capability that creates a tight seamless integration between Cosmos DB and Synapse Analytics. It gives you the ability to gain near real-time analytics and insights over operational data in Cosmos DB with no ETL and no impact to the performance of OLTP transactions in Cosmos DB containers.

Let us break that down. Cloud-native (if you didn’t click the link) is the modern approach, where you design systems using cloud services to scale and perform well consistently. Synapse Analytics (if you are not familiar) can be thought of as Microsoft’s cloud data warehouse, for starts. And that is because Synapse is a lot more than that, but we have to start somewhere, don’t we?

So, Synapse Link creates a seamless, automagic integration between Cosmos DB and Synapse Analytics, thus removing the need for ETL. How does that work? Because a picture is worth a thousand words, I have referred to a diagram from Microsoft’s official doco on Synapse Link. The highlighted portion is new and works behind the scenes to deliver near-real time analytics with no additional ETL. When we create a container in an Azure Cosmos DB account that has Synapse Link enabled, an analytical store is automatically provisioned. This analytical store helps to ensure that there is no impact to OLTP transactions against the Cosmos DB container.

Image courtesy: Microsoft

This is a robust mechanism to perform large-scale analytics over data in Cosmos DB and implement an archival policy efficiently to keep the containers sleek without losing access to valuable historical data. It is worth noting that the transactional and analytical stores get their own, separate TTL (Time to Live) properties. TTL is one of my favorite features of Cosmos DB. Self-destruction can be so powerful sometimes! I will cover this in more detail in my sample solution.

Sample Solution

Confucius says, “I hear and I forget. I see and I remember. I do and I understand”. So, I built a sample solution that would ingest data into Cosmos DB at scale, and I was impressed at just how quickly data was available downstream in Synapse Analytics. The sample solution features a Python Notebook, running on Databricks and ingesting the popular New York City taxi trip data into a Cosmos DB container using Cosmos DB Spark 3 OLTP connector for SQL API. The trip data that became available in Synapse Analytics was used to build a Power BI dashboard, thus effectively producing near real-time analytics with no ETL and minimal code. I will give a step-by-step breakdown of the sample solution. Refer to this guide by Microsoft for more details.

Sample Cosmos DB HTAP solution
Sample solution using NYC Taxi trip data

1. Cosmos DB container

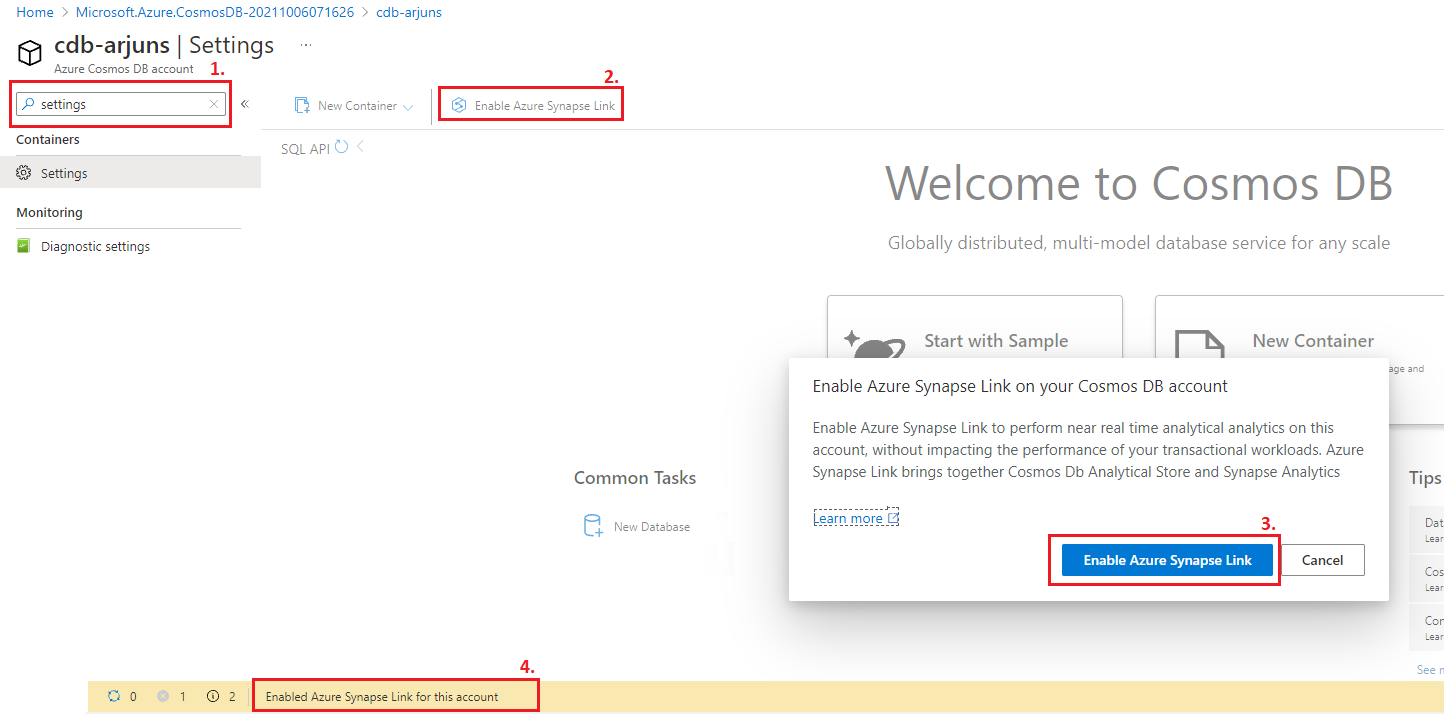
Firstly, we want to enable Synapse Link in the Cosmos DB account using the Settings blade. It is worth noting that at the time of writing this article (Oct 2021), Synapse Link and analytical store is supported only for SQL and MongoDB APIs.

Enable Azure Synapse Link

At the moment, analytical store can be turned ON only for new containers. If you wish to make use of Cosmos DB’s HTAP capabilities for an existing container, you will need to migrate data to a new container. Note that containers cannot be renamed. Auto-sync latency is within 2 minutes, as per Microsoft documentation. In my tests, I did not see a delay of more than a minute or so for data to be available downstream in Synapse Analytics.

New Cosmos DB container with Analytical store turned ON

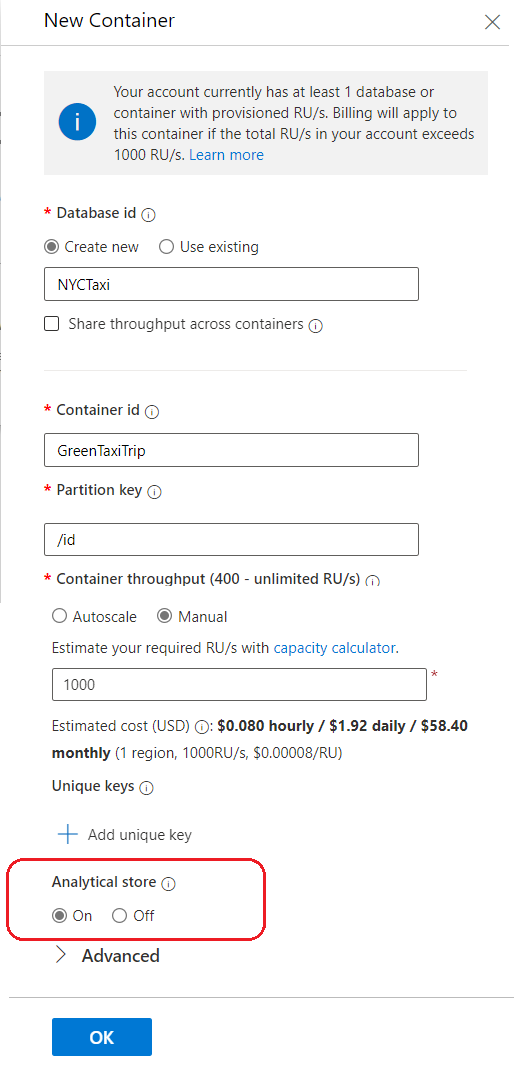
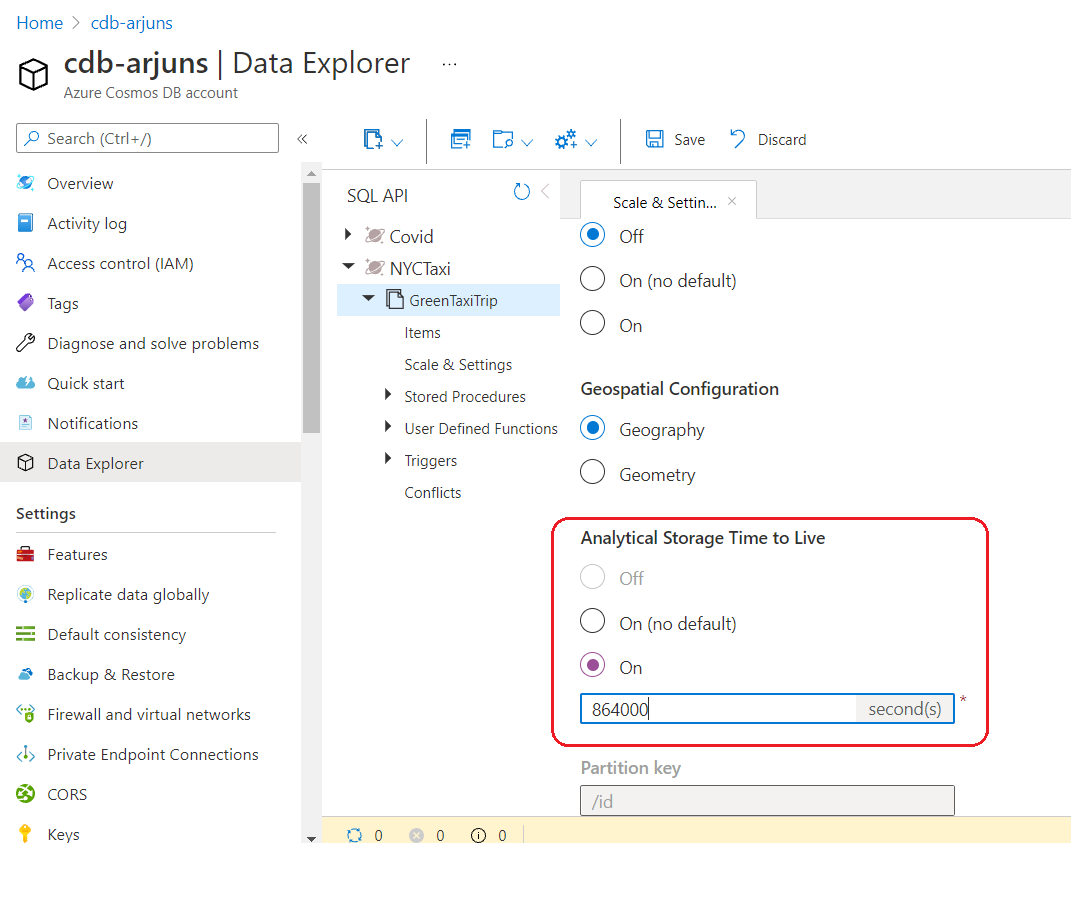
Analytical store does not need request units (RU/throughput) to be allocated, nor does it consume the RU assigned to the transactional store – 1000 in the snip above. Analytical store follows a consumption-based pricing model, which is based on data storage and analytical read/write operations and queries executed. Storage can be optimized by setting the Analytical Store Time To Live property in the Data Explorer blade under Scale & Settings option. This dictates for how long data would be retained in the analytical store, and is independent from the container TTL property. You should set the Analytical Store TTL to a value that gives you sufficient time to process the data and persist or derive insights from it as required. At the time of writing this article (Oct 2021), analytical store does not support backup and restore, i.e. if a Cosmos DB backup is restored, only the transactional store will be recovered. It is also worth noting that schema representation in the analytical store could be different from the container schema.

Analytical Store Time to Live

2. Databricks – Python notebook to write NYC Taxi trip data to Cosmos DB

In the sample solution, I used a Python notebook to write data to Cosmos DB using the Spark 3 OLTP Connector for SQL API. This was just to simulate incoming OLTP application requests.

Python notebook
Sample data

3. Synapse Analytics

In the Synapse Workspace, Cosmos DB analytical store may be accessed using the Spark pool or built-in serverless SQL pool. I used the serverless SQL pool, which is a pay per query distributed data processing system built for big data and computational functions.

In the Synapse Studio, I created a linked service by connecting to the external Cosmos DB resource.

Connect to Azure Cosmos DB

In this case, I chose Managed Identity as the authentication method.

New Linked Service – Cosmos DB SQL API

In a little while, the linked service was added. At this stage, we are almost ready to query the underlying analytical store of GreenTaxiTrip container.

The next step was to create a user database in the serverless SQL pool, so that a CREDENTIAL could be created to access the Cosmos DB database securely. You cannot create the credential in master database.

4. Data Ingestion

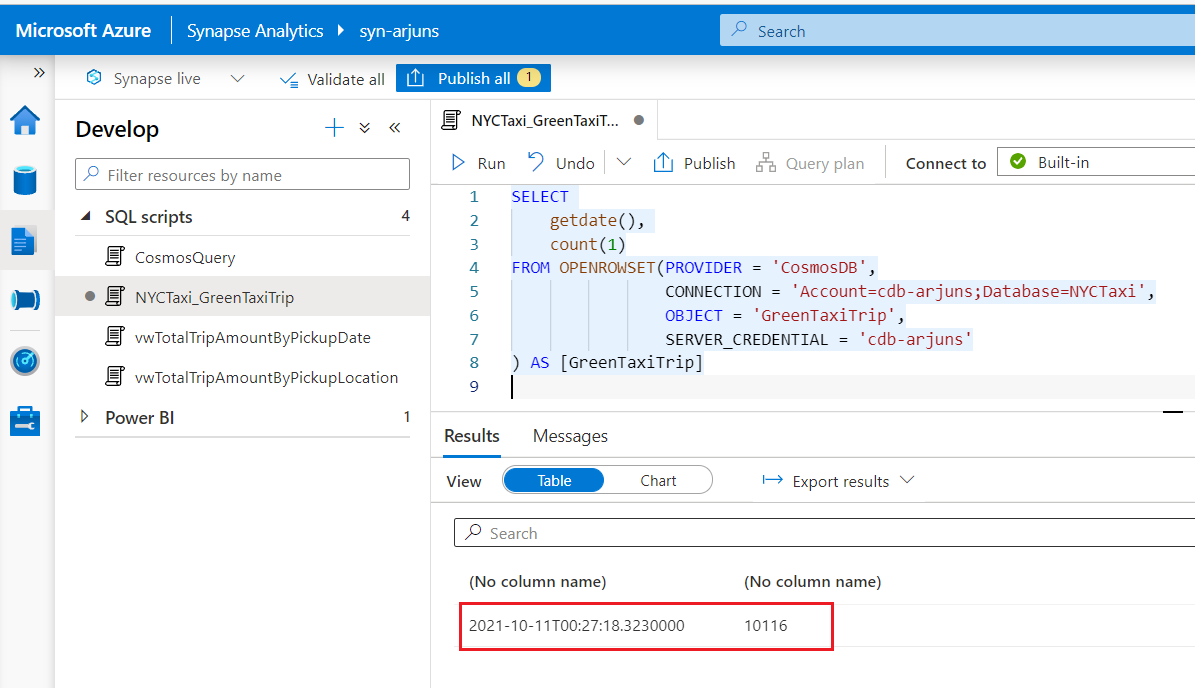
I scheduled a Databricks job to execute the Python notebook to ingest NYC Taxi trip data from DBFS to Cosmos DB using the Spark 3 OLTP connector for SQL API. You may also execute it manually. Once data became available in Synapse Analytics through the analytical store, I wrote a couple of queries over the data using familiar T-SQL and converted them to views.

Databricks Job
Cosmos DB query

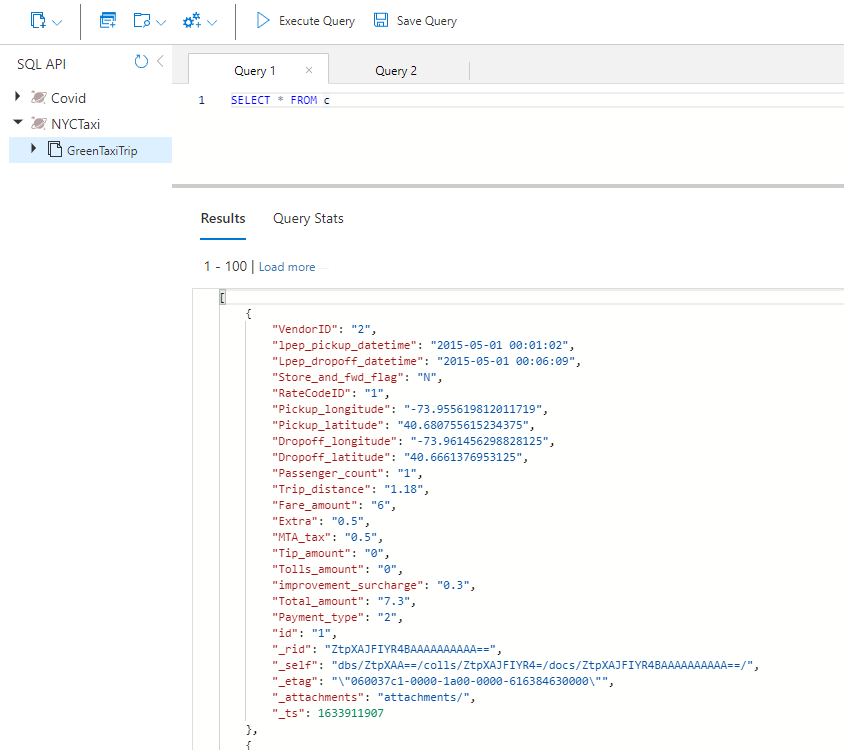
Note the number of records, and the corresponding timestamp in the transactional store. When the record count query completed in Synapse Analytics 9 seconds later, the number of records were out by only 545! Auto-sync latency is 2 minutes, as per Microsoft doco. It is worth noting that even if a document had a TTL set to lower than 2 minutes, it would still appear in the analytical store however, I have not tested it.

Cosmos DB – transactional store record count

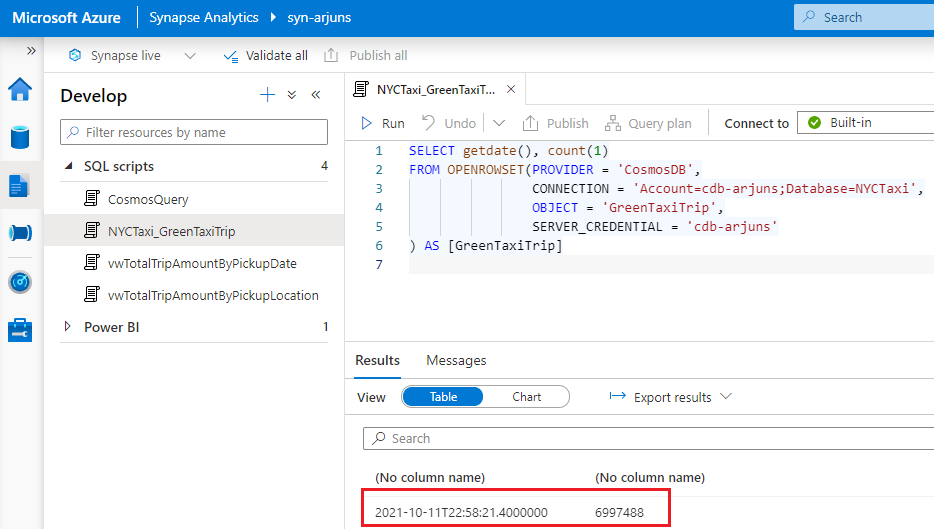
My test dataset had 7 million records, and I left the job running to see how well the analytical store would perform. I was quite satisfied with the performance of Synapse Link. In this case, I used only one container but it would be interesting to see how well auto-sync holds up at scale.

5. Near real-time analytics using Power BI

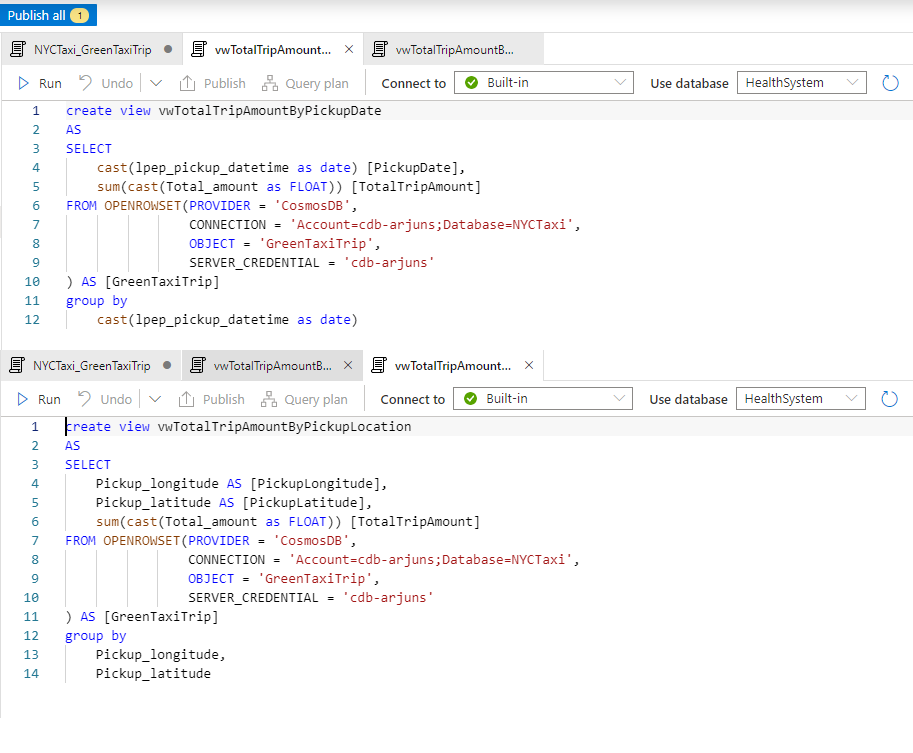
Having validated that trip data written to the Cosmos DB container were visible in Synapse Analytics in near real-time, I proceeded to create 2 simple views using the OPENROWSET function, and a Power BI dashboard that used the views as its data source. Please excuse my lazy visualization efforts, but the point is you can easily get near real-time insights over operational data at scale using Synapse Link. All without any ETL!

Views created in Synapse serverless SQL pool over data in analytical store

Other alternatives

When it comes to enabling analytics over operational data in Cosmos DB, I cannot think of a better way to do it. The Change Feed way of doing it is not as scalable or easily maintainable as using Synapse Link. The obvious difference is that you will need a Synapse Analytics account to make use of Synapse Link. If you are a Microsoft house, this would make sense as Synapse is the unified analytics service and integrates directly with several services such as Azure Machine Learning, Cognitive Services and Power BI.

Limitations

At the time of writing this article (Oct 2021), Synapse Link for Cosmos DB is only supported for the SQL and Mongo DB APIs. I think it will be really cool to have it enabled for the Gremlin API. Graph databases are getting increasingly popular, and graph-enabled analytics such as fraud detection and money laundering is bound to become more common place.

More limitations are available here. The most glaring one is the lack of support for backup and restore of data in the analytical store.

The road ahead

HTAP is made possible by the power of cloud computing. I believe it will not be too long before HTAP capability is available for Azure SQL databases. That will be quite a game changer!

Aside from the basic Business Intelligence feature I demonstrated in the sample solution, Synapse Analytics also enables batch scoring using native scoring for models trained using RevoscalePy and RevoscaleR packages, AutoML to develop a Regression/Classification/Time Series Forecasting model using the Azure Machine Learning linked service, and multi language support for advanced analytics using the Spark pool.

Cosmos DB’s HTAP capability is fascinating, and I can think of several use cases to enable real-time decision intelligence at scale. I hope you had a good read. Please leave a comment if you have questions or any feedback.

References

https://docs.microsoft.com/en-us/azure/cosmos-db/synapse-link
https://docs.microsoft.com/en-us/azure/cosmos-db/analytical-store-introduction
https://docs.microsoft.com/en-us/azure/cosmos-db/configure-synapse-link
https://www.youtube.com/watch?v=H6Ei_t34BGs – Jovan Popovic
https://www.youtube.com/watch?v=yd8vynwA36A – Microsoft Mechanics
https://devblogs.microsoft.com/cosmosdb/spark-3-connector-databricks/
https://docs.microsoft.com/en-us/azure/cosmos-db/sql/create-sql-api-spark
https://docs.microsoft.com/en-us/azure/cosmos-db/sql/sql-api-sdk-java-spark-v3
https://github.com/Azure/azure-sdk-for-java/blob/main/sdk/cosmos/azure-cosmos-spark_3-1_2-12/docs/configuration-reference.md#write-config
https://docs.microsoft.com/en-us/sql/relational-databases/security/authentication-access/credentials-database-engine?view=sql-server-ver15
https://docs.microsoft.com/en-us/azure/synapse-analytics/sql/develop-openrowset
https://docs.microsoft.com/en-us/azure/synapse-analytics/machine-learning/tutorial-automl

Importance of data governance in the Covid era

One common theme that stood out last year is the oversupply of data to our fingertips. In my line of work as a data professional, I produce, consume and explain datasets and data visualizations on a regular basis. As a common man though, I did not discuss histograms and rolling averages at the dinner table until Covid struck. 2020 was a year that forced the common man to read and understand data visualizations and metrics. Terms such as “growth factor”, “flattening the curve” and “logarithmic scale” became more popular.

Data Management in public and private sectors

When confounded with complex problems, organizations in both public and private sectors store, analyze and utilize existing data at scale to predict future trends. Each of these steps is very important; only organizations that have effective and mature data management strategies are able to traverse this kind of turbulence successfully. Therefore, defining and implementing a robust data management strategy uplifts the value proposition of an organization. In the private sector, organizations have already been investing heavily in big data platforms and predictive capabilities. Accelerated digitization in the public sector has forced governments to invest heavily in these areas in recent times.

In pandemic times, it takes monumental efforts to churn out daily stats and projections about the disease with high accuracy. I have huge respect for the public service officials and researchers who work tirelessly to achieve this while we navigate our way out of this predicament. In the private sector, we rely a lot on past trends to measure current state and calibrate efforts and priorities to meet annual or periodic targets. Metrics such as “YoY – Year on Year”, “STLY – Same Time Last Year” and “Budget Variance” are usual indicators that we track to report on revenue risk position. They usually serve well, until there are anomalies. Covid 19 is one big anomaly! Depending on which industry you are in, the current trends would be far from previous years that leave you fuming or beaming. As my financial advisor said, one thing is for sure – if anyone claims they know how the markets are going to trend in the coming months, they are lying!

Data Governance

Covid-driven disruption calls for a higher degree of consistency and clarity on the data assets handled by any organization, because in the months to come there will be a lot of flux in data utilized by various departments and how they would be interpreted. Without sound governance, this could lead to a low level of trust in analytics measures used as performance indicators. While data governance was important previously, it is paramount in the current business climate. So, what is data governance really? In simple terms – it is effective handling or management of data assets across an organization.

I thought those were wise words from Satya Nadella, during Microsoft’s timely announcement of Azure Purview – their unified data governance tool. Data governance forms one part of Enterprise Data Management, which may be defined as – using data to take informed decisions. Data governance framework is often the invisible thread that connects all organizational roles that deal with data. Let me briefly explain the key principles of data governance, and what it takes to achieve data governance maturity. Hopefully, this will help you understand why it is important to focus on data governance and the enterprise-wide benefits it brings.

Key principles of Data Governance

  1. Transparency: Data governance is one of those efforts that needs buy in from all departments within an organization. It is impossible to get their buy in if they are not well-informed of the processes involved in achieving and maintaining data governance maturity, and its impact. Being transparent is about clearly explaining why things are done in a certain way and how it fits into the data management life cycle.
  2. Accountability: Accountability is about identifying, communicating and acknowledging the roles and responsibilities of all staff who are involved in data governance. They are to be held accountable for taking action at the times dictated by their roles. Good data is everyone’s responsibility, however accountability lies with designated staff members.
  3. Standardization: Standardization enables data consistency and quality. It is about labeling, describing, classifying and certifying data assets in a standardized or consistent manner. This results in removing barriers to data consumption and makes the available data more valuable and explainable.

While there could be several intangible benefits resulting from deployment of data governance initiatives, immediate benefits are improvement of data quality, better compliance and security, and increased visibility of data assets and their lineage driving the value of data. Once policies and processes are well defined, accountability is established, and decision structures and rules are in play, we could say that data governance has improved. To measure the level of maturity though, we should ask ourselves more questions. Before I delve into that, I want to touch upon data governance domains. It is to be noted that these are focused on creating a data-centric culture and developing a more data-mature organization.

Data Governance domains

  1. Data Principles: One of the initial steps in data governance is clarifying the role of data as an asset for the organization. This ties closely with organizational goals and business context. This also highlights the importance of engaging all departments, because context is subjective.
  2. Data Quality: There is nothing more embarrassing to an Analytics team than presenting bad or erroneous data. Data quality involves determining requirements or intended use of data assets. Based on these, rules are to be defined and data quality reports to be produced at regular intervals to maintain a high degree of trust.
  3. Metadata, Glossary and Master Data Management: Semantics or description of data enables exploration. Presence of a data glossary helps both technical and non-technical audiences understand and adopt data assets for their use. Master data or reference data refers to data points on various subjects of interest such as customers, products and vendors that could be scattered across applications and functional areas in an enterprise. Master data management is about ensuring the accuracy, completeness and consistency of enterprise-wide reference data.
  4. Data Access and Compliance: It is great to curate data assets and remove barriers to their adoption, but who should have access to what data, and for how long? These are important aspects, with regulations concerning data management such as GDPR becoming more stringent over the years. Granting of data access permissions need to be well-controlled and both local and international laws be taking into account throughout the data life cycle.
  5. Analytics and Business Intelligence: Depending on the data analytics maturity of your organization, you may have business intelligence (BI) solutions or self-service BI capabilities. If you are further down the track, you’d have predictive capabilities that open up new avenues of business for you. No matter at what stage you are, you should have good quality data and solid data literacy in the organization to reap maximum rewards. Data governance should support analytics and BI efforts in areas such as deciding what data to use for exploration or to generate insights, who gets to decide what data is collected and measured, who gets access to this data and so forth.
Data Analytics Maturity – stages
Courtesy: https://info.microsoft.com/rs/157-GQE-382/images/EN-CNTNT-SQL-Data%20Analytics%20Maturity%20Model-en-us.pdf

Data Governance Council

Data governance council is a body responsible for strategic guidance of the data governance program. It is one piece of organizational governance. I believe every organization should have one in order to treat data as a valuable business asset, and create a data centric culture where good data is everyone’s responsibility.

Courtesy: I had this image saved away in a presentation I put together a while ago, can’t remember source. Please message me if you know so that I can add a reference.

Data governance council is formed of business unit heads, representatives and nominated data stewards from each business team. It is a collaborative effort that brings together key players from all departments within an organization. The council handles data projects and initiatives, data policies, standards and aims to improve data awareness. Data quality issues are reviewed, corrective measures agreed on and implemented with a view to always maintaining data validity. The grand vision of a data governance council could be a building a more data-mature organization.

Implementation/Tools

Data governance implementation requires a concerted effort that needs to be announced, endorsed and supported by business leaders. Depending on size of the organization, it may prove to be quite a herculean task. There are several enterprise tools available to make this journey easier, however a tool may not always the right answer. It is perfectly okay to kick off assessment and policy definition phases without adopting a dedicated tool. Data governance is more about people and how they use data and less about tooling. That said, a few popular tools are Collibra, Informatica and Talend. As I mentioned earlier in this blog, Microsoft recently announced their new governance tool – Azure Purview, which looks promising if you already use Azure data products.

Measure of Progress

I hope this has been an interesting read so far and you are convinced that data governance is an area that needs more attention in the months to come. If your organization already has a data governance program, how can you measure its progress? There are a few key questions you could try to answer, and they might help you evaluate your data governance maturity.

  1. Is data that is available for consumption complete, and is it available on time?
  2. Are you happy with the quality of data, are there data quality reports available and are they reviewed?
  3. Is there a data glossary available and is it up to date, is data lineage clearly defined?
  4. Are compliance and security measures satisfactory?
  5. Is Business Intelligence platform helping teams achieve their goals, are analytics solutions adding value?

No business is perfect and has answers to all questions. The idea is to be prepared and ready to solve complex business problems by leveraging your curated data assets so that better decisions can be taken quicker to make a difference.

Hello 2021

Last year has thrown a number of obstacles at us. It is no longer possible to keep doing what we had been doing and expect great results. Rules of the game have changed, and we need to be quick to adapt to change, for change is the only constant. If you are a data professional, now is an exciting time to review your standard practices, tweak and refine them to ensure that your business keeps going from strength to strength. As the old adage goes, when the going gets tough, the tough get going!

Happy new year! I wish you a wonderful year and decade ahead.

References:

https://www.linkedin.com/learning/learning-data-governance/welcome
https://profisee.com/data-governance-what-why-how-who/
https://www.leighpartnership.com/putting-the-data-strategy-to-work/
https://www.leighpartnership.com/2834-2/
https://www.lightsondata.com/data-governance-maturity-models-dataflux/

Azure Cosmos DB: real-time data movement using Change Feed and Azure Functions

Many people who read my Cosmos DB articles are looking for an effective way to export data to SQL, either on-demand or in real-time. After performing a search term analysis for my blog earlier this year, I had made up my mind about posting a solid article on exporting data from Cosmos DB to SQL Server.

Note that this serverless and event-based architecture may be used to not only persist Cosmos DB changes to SQL Server, but trigger alternate actions such as stream processing or loading to blob/Data Lake.

CosmosDBSearches_SQLRoadie.jpg

Real-time ETL using Cosmos DB Change Feed and Azure Functions

In this article, we will focus on creating a data pipeline to ETL (Extract, Transform and Load) Cosmos DB container changes to a SQL Server database. My main requirements or design considerations are:

  • Fault-tolerant and near real-time processing
  • Incur minimum additional cost
  • Simple to implement and maintain

Cosmos DB Change Feed

Cosmos DB Change Feed listens to Cosmos DB containers for changes and outputs the list of items that were changed in the chronological order of their modification. Cosmos DB Change Feed enables building efficient and scalable solutions for the following use cases:

  • Triggering a notification or calling an API
  • Real-time stream processing
  • Downstream data movement or archiving

AzureCosmosDBChangeFeedOverview

Types of operations

  • Change feed tracks inserts and updates. Deletes are not tracked yet
  • Cannot control change feed to track only one kind of operation, for example only inserts
  • For tracking deletes in the Change Feed, workaround is to soft-delete and assign a small TTL (Time To Live) value of “n” to automatically delete the item after “n” seconds
  • Change Feed can be read for historic items, as long as the items have not been deleted
  • Change Feed items are available in order of their modification time (_ts system attribute), per logical partition key, and tagged with the same _lsn (system attribute) value for all items modified in the same transaction

Read more about Azure Cosmos DB Change Feed from Microsoft docs to gain a thorough understanding. Change Feed can be processed using Azure Functions or Change Feed Processor Library. In this article, we will use Azure Functions.

Azure Functions

Azure Functions is an event-driven, serverless compute platform for easily running small pieces of code in Azure. Key points to note are:

  • Write specific code for a problem without worrying about an application or the infrastructure to run it
  • Use either C#, F#, Node.js, Java, or PHP for coding
  • Pay only for the time your code runs and trust Azure to scale
  • As of July 2019, the Azure Functions trigger for Cosmos DB is supported for use with the Core (SQL) API only

Read more from Microsoft docs to understand full capabilities of Azure Functions.

If you use Consumption plan pricing, it includes a monthly free grant of 1 million requests and 400,000 GBs of resource consumption per month per subscription in pay-as-you-go pricing across all function apps in that subscription, as per MS docs.

Compare hosting plans and check out pricing details for Azure Functions at the Functions pricing page to gain a thorough understanding of pricing options.

Real-time data movement using Change Feed and Azure Functions

The following architecture will allow us to listen to a Cosmos DB container for inserts and updates, and copy changes to a SQL Server Table. Note that Change Feed is enabled by default for all Cosmos DB containers.

I will create a Cosmos DB container and add an Azure Function to listen to the Cosmos DB container. I will then modify the Azure Function code to parse modified container items and save them to a SQL Server table.

1. First, I navigated to Azure portal, Cosmos DB blade and created a container called reservation in my Cosmos DB database. As it is purely for the purposes of this demo, I assigned lowest throughput of 400 RU/s

01_ContainerCreation02_ContainerCreated


2. Now that the container is ready, proceed to create an Azure Function App. The Azure Function will be hosted in the Azure Function app

03_AddFunctionApp.png

04_AddFunctionApp.png


3. Add an Azure Function within the newly created Azure Function App. Azure Function trigger for Cosmos DB utilizes the scaling and event-detection functionalities of Change Feed processor, to allow creation of small reactive Azure Functions that will be triggered on each new input to the Cosmos DB container.

055_AzureFunction.png

05_FunctionAppCreated.png

06_AddAzureFunction


4. Configure the trigger. Leases container may be manually created. Alternately, check the box that says “Create lease collection if it does not exist”. Please note that you would incur cost for storage and compute for leases container.

07_AzureFunctionConfig

I got this error that read – “The binding type(s) ‘cosmosDBTrigger’ are not registered. You just need to install the relevant extension. I saw many posts about this, so it will most likely be fixed soon.

08_AzureFunctionBindingError.png

Sort out the error by installing the extension for Azure Cosmos DB trigger.

09_AzureCosmosDBTriggerExtensionInstall


5. Once the function is up and running, add an item to the reservations container that we are monitoring. And we have a working solution!

10_CosmosDBContainer_AddEntries11_AzureFunctionRunning


6. Trigger definition may be modified to achieve different things, in our case we will parse the feed output and persist changes to SQL server. You can download the csx file I used.

12_AzureFunctionDefinitionModify.png

13_AzureCosmosDBContainer_ModifyItem14_AzureFunction_SavingToDatabase15_SavedInDatabase

Summary

We have successfully implemented a serverless, event-based low cost architecture that is built to scale. Bear in mind that you would still end up paying for Azure Function and the underlying leases collection, but there will be minimum additional RU cost incurred from reading your monitored container(s) as you are tapping into the Change Feed.

You can monitor the function and troubleshoot errors.

17_Funcion_Control20_Monitor_AzureFunction

I hope you found the article useful. Add a comment if you have feedback for me. If you have any question, drop me a line on LinkedIn. I’ll be happy to help 🙂 Happy coding!

Resources:

https://docs.microsoft.com/en-us/azure/cosmos-db/change-feed
https://docs.microsoft.com/en-us/azure/cosmos-db/changefeed-ecommerce-solution
https://azure.microsoft.com/en-au/services/functions/
https://docs.microsoft.com/en-us/azure/azure-functions/functions-overview
https://docs.microsoft.com/en-us/azure/azure-functions/functions-bindings-cosmosdb-v2
https://docs.microsoft.com/en-us/azure/cosmos-db/change-feed-functions
https://azure.microsoft.com/en-au/resources/videos/azure-cosmosdb-change-feed/
https://h-savran.blogspot.com/2019/03/introduction-to-change-feed-in-cosmos.html

Demo: Predictive Modeling using R and SQL Server Machine Learning Services

Late last year, I wrote a series of articles about Predictive Modeling using R and SQL Server Machine Learning Services. At the time, I thought MLS was an underutilized feature of SQL Server. With a view to sharing my learning on the topic, I presented a session at the local SQL Server User Group earlier this month.

Presentation

MLS at QLD SQL Server User Group

This article will be focused on content presented at the User Group meeting. Below is the presentation I put together. If you are new to Machine Learning on premises, it will help you understand the capabilities of this powerful feature of SQL Server.

Demo

As a typical data nerd, I was more excited about the demo than the session itself. For the demo, I chose to predict heart disease risk using the popular heart disease data set from UCI.

https://archive.ics.uci.edu/ml/machine-learning-databases/heart-disease/processed.cleveland.data

https://archive.ics.uci.edu/ml/machine-learning-databases/heart-disease/heart-disease.names

  1. Using R, a predictive model is trained and tested against known results.
  2. After testing and comparing a few Machine Learning models, the R scripts were wrapped in SQL Server Stored Procedures letting us execute R scripts through Stored Procedures
  3. The trained models were stored in a SQL Server table, and were used to perform Machine Learning predictions through Stored Procedure calls
  4. Last step in the demo covered Native Scoring using the native C++ extension capabilities in SQL Server 2017

Demo solution is available for download at https://github.com/sqlroadie/PredictiveModelingUsingRandSQLServerMLS

Solution contains the following files:

  • heart-disease.data – UCI dataset attached for reference heart-disease.names – Data description. Go through this file to understand what the variables mean
  • PredictiveModelingUsingR.r – R script (with comments wherever applicable) that builds the predictive Model using RevoScaleR package. Go through this to understand how the models are created and used for prediction.
  • PredictiveModelingUsingMLS.sql – SQL script that uses R code covered in the previous file to build a Machine Learning predictive model that is executed in the SQL on premises instance

Predictive Modeling using R and SQL Server Machine Learning Services

If you need a hand with the demo, please drop me a note. LinkedIn is the best way to get in touch with me. Happy learning!

Thanks to Wardy IT and their Marketing Manager, Michaela Murray, for their continued efforts on organizing the user group meetings.

Analyzing Heart Disease risk using Key Influencers AI visual in Power BI

The Gartner Magic Quadrant for 2019, announced earlier this month, names Microsoft the leader in Analytics and Business Intelligence Platforms. Microsoft also coincidentally announced the public preview release of its first AI-driven visual for Power BI Key Influencers – this month, among a number of new features for Feb 2019. Inbuilt integration of Power BI with many Azure data products would catapult Power BI miles ahead of Tableau in the long run.

EN-CNTNT-GartnerMQ-BI2019.jpg

Key Influencers is the first of many AI visuals Microsoft would release I assume, in their efforts to democratize AI and make their customers look cool 🙂 In this article, we will go over the various features of this new visual using a publicly available dataset, and get familiar with interpreting the results. Download a copy of Power BI Desktop file for the example I am using in this article and try it out yourself using the free Power BI Desktop tool.

Key Influencers

Key Influencers is a powerful Power BI visual that lets us understand the factors that drive a metric. Power BI analyzes data, ranks the factors that matter, and displays them as key influencers. Under the hood, Power BI uses ML.NET to run logistic regression to calculate the key influencers. Logistic regression is a statistical model that compares different groups to each other, also taking into consideration the number of data points available for a factor.

As the visual is still in preview, there are a number of limitations. My first attempt to use Key Influencers using a survey responses dataset was rather unimpressive.

In my second attempt, I used the popular Heart Disease dataset from UCI to identify key influencers affecting heart disease, and achieved good results.

Heart Disease - Key Influencers Power BI.jpg

Limitations

Before we delve any further, let us take a look at the limitations that apply in the public preview phase of the visual. Pay attention here to avoid frustration as you explore the visual.

Following features are not supported:

  • Analyzing metrics that are aggregates/measures
  • Direct Query / Live Connection / Row Level Security – support
  • Consuming the visual in Power BI Embedded and Power BI mobile apps

Using the Key Influencers Visual

As a first time user, I found the Key Influencers visual intuitive and self-explanatory. It hardly takes a few minutes to set up the visual once you have clean data. Check out Microsoft documentation to understand all aspects of the visual. You could also download a copy of Power BI Desktop file for the example I am using in this article.

Note: Keep column names readable as this will help interpret the visual better

Getting Familiar

There are 2 tabs available within the visual – Key influencers and Top Segments.

The Key influencers tab displays the key factors affecting the metric value selected. In this case, the top factor that affects positive diagnosis of Heart Disease, based on our dataset, is Reversible Defect Thalassemia – increasing the risk of heart disease by 2.83 times when the value of Reversible Defect Thalassemia is 7.

On the right hand side, there is a column chart showing distribution of the selected factor. The check box at the bottom lets you display only influential factor values. We could click-select a different factor to see how it contributes to heart disease.

Heart Disease - Key Influencers Power BI - Getting Familiar.jpg


The Top segments tab displays different segments identified by Power BI within the population, for the metric value selected. Click-select a segment to view more details such as the factor values that define the segment, and how the segment compares against the average. We could also drill down further into the segment to split by additional fields.

Under the hood, Power BI uses ML.NET to run a decision tree to find interesting subgroups. The objective of the decision tree is to end up with a subgroup of datapoints that is relatively high in the metric we are interested in – in our case, the patients who  are suspected to have heart disease.

Heart Disease - Key Influencers Power BI - Top Segment.jpg


Heart Disease - Key Influencers Power BI - Top Segment Details.jpg

First Impression

Considering that it is still in preview and is only going to get better, Key Influencers ticks the right boxes. The rationale behind choosing a popular dataset, such as the Heart Disease dataset from UCI, for my example was to allow for comparison of results to Machine Learning models that are already publicly available. Power BI seems to identify influencers correctly and does a good job at presentation. I’m thoroughly impressed by this new feature.

Suggested Reading

If you enjoyed this article, consider reading my other articles on Azure data products.

https://sqlroadie.wordpress.com/2018/04/29/what-is-azure-cosmos-db/
https://sqlroadie.wordpress.com/2018/08/05/azure-cosmos-db-partition-and-throughput/
https://sqlroadie.wordpress.com/2019/02/17/azure-databricks-introduction-free-trial/

Resources:

Download the Power BI workbook used in the example – https://drive.google.com/open?id=13Pt25UPt7dOW3raZmavHHVl7gAStv5uy
Intro to Key Influencers by Microsoft: https://docs.microsoft.com/en-us/power-bi/visuals/power-bi-visualization-influencers
Power BI Feb 2019 feature summary – https://powerbi.microsoft.com/en-us/blog/power-bi-desktop-february-2019-feature-summary/

Heart Disease Data source
Donor:  David W. Aha (aha ‘@’ ics.uci.edu) (714) 856-8779
Creators:

  • Hungarian Institute of Cardiology. Budapest: Andras Janosi, M.D.
  • University Hospital, Zurich, Switzerland: William Steinbrunn, M.D.
  • University Hospital, Basel, Switzerland: Matthias Pfisterer, M.D.
  • V.A. Medical Center, Long Beach and Cleveland Clinic Foundation: Robert Detrano, M.D., Ph.D.

Azure Databricks – Introduction (Free Trial)

Microsoft’s Azure Databricks is an advanced Apache Spark platform that brings data and business teams together. In this introductory article, we will look at what the use cases for Azure Databricks are, and how it really manages to bring technology and business teams together.

Databricks

Before we delve deeper into Databricks, it is good to have a general understanding of Apache Spark.

Apache Spark is an open-source, unified analytics engine for big data processing, maintained by the Apache Software Foundation. Spark and its RDDs were developed in 2012 in response to limitations of MapReduce. 

Key factors that make Spark ideal for big data processing are:

  • Speed – up to 100X faster
  • Ease of use – code in Java, Scala, Python, R and SQL
  • Generality – use SQL, streaming and complex analytics
Apache Spark Ecosystem.jpg
Pic courtesy: Microsoft

Databricks – the company – was founded by creators of Apache Spark. Databricks provides a web-based platform for working with Spark, with automated cluster management and IPython-style notebooks. It is aimed at unifying data science and engineering across the Machine Learning (ML) life cycle from data preparation, to experimentation and deployment of ML applications. Databricks, by virtue of its big data processing capabilities, also facilitates big data analytics. Databricks, as the name implies, thus lets you build solutions using bricks of data.

Azure Databricks

Azure Databricks combines Databricks and Azure to allow easy set up of streamlined workflows and an interactive work space that lets data teams and business collaborate. If you’ve been following data products on Azure, you’d be nodding your head along, imagining where Microsoft is going with this 🙂

Azure Databricks enables integration across a variety of Azure data stores and services such as Azure SQL Data Warehouse, Azure Cosmos DB, Azure Data Lake Store, Azure Blob storage, and Azure Event Hub. Add rich integration with Power BI, and you have a complete solution.

Azure Databricks Overview
Pic courtesy: Microsoft

Why use Azure Databricks?

By now, we understand that Azure Databricks is an Apache Spark-based analytics platform that has big data processing capabilities and brings data and business teams together. How exactly does it do that, and why would someone use Azure Databricks?

  1. Fully managed Apache Spark clusters: With the serverless option, create clusters easily without having to set up your own data infrastructure. Dynamically auto-scale clusters up and down, and auto-terminate inactive clusters after a predefined period of inactivity. Share clusters with your teams, reduce time spent on infrastructure management and improve iteration time.

  2. Interactive workspace: Streamline data processing using secure workspaces, assign relevant permissions to different teams. Mix languages within a notebook – use your favorite out of R, Python, Scala and SQL. Explore, model and execute data-driven applications by letting Data Engineers prepare and load data, Data Scientists build models, and business teams analyze results. Visualize data in a few clicks using familiar tools like Matplotlib, ggplot or take advantage of the rich integration with Power BI.

  3. Enterprise security: Use SSO through Azure Active Directory integration to run complete Azure-based solutions. Roles-based access control enables fine-grained user permissions for notebooks, clusters, jobs, and data.

  4. Schedule notebook execution: Build, train and deploy AI models at scale using GPU-enabled clusters. Schedule notebooks as jobs, using runtime for ML that comes preinstalled and preconfigured with deep learning frameworks and libraries such as TensorFlow and Keras. Monitor job performance and stay on top of your game.

  5. Scale seamlessly: Target any amount of data or any project size using a comprehensive set of analytics technologies including SQL, Streaming, MLlib and GraphX. Configure number of threads, select number of cores and enable autoscaling to dynamically scale processing capabilities leveraging a Spark engine that is faster and performant through various optimizations at the I/O layer and processing layer (Databricks I/O).

Of course, all of this comes at a price. If this article has piqued your interest, hop over to Azure Databricks homepage and avail the 14 day free trial!

Azure Databricks - Free Trial 14 days.jpg

Suggested learning path:

  1. Read more about Azure Databricks – https://docs.microsoft.com/en-us/azure/azure-databricks/what-is-azure-databricks
  2. Create a Spark cluster and run a Spark job on Azure Databricks – https://docs.microsoft.com/en-us/azure/azure-databricks/quickstart-create-databricks-workspace-portal#clean-up-resources
  3. ETL using Azure Databricks – https://docs.microsoft.com/en-us/azure/azure-databricks/databricks-extract-load-sql-data-warehouse
  4. Stream data into Azure Databricks using Event Hubs – https://docs.microsoft.com/en-us/azure/azure-databricks/databricks-stream-from-eventhubs
  5. Sentiment analysis on streaming data using Azure Databricks – https://docs.microsoft.com/en-us/azure/azure-databricks/databricks-sentiment-analysis-cognitive-services

I hope you found the article useful. Share your learning experience with me. My next article will be on Real-time analytics using Azure Databricks.

Azure Databricks - Real time analytics.jpg
Azure Databricks

Resources:

https://azure.microsoft.com/en-au/services/databricks/
https://databricks.com/product/azure
https://docs.microsoft.com/en-us/azure/azure-databricks/what-is-azure-databricks
https://docs.microsoft.com/en-us/azure/azure-databricks/quickstart-create-databricks-workspace-portal#clean-up-resources
https://databricks.com/blog/2019/02/07/high-performance-modern-data-warehousing-with-azure-databricks-and-azure-sql-dw.html

Global AI Bootcamp – Developing AI, responsibly

Global AI Bootcamp, Brisbane 2018

Yesterday, I attended the Global AI Bootcamp Brisbane (at the Precinct, Valley) along with nearly 100 other technology enthusiasts. The event was well organized by David Alzamendi of Wardy IT Solutions and Thiago Passos of SSW Consulting. I rocked up to the event hoping to get an update on the rapidly evolving Data Platform offerings from Microsoft. While the event did meet most of my expectations, it planted one particular seed of thought in my head. As I walked away at end of the day, I was enthralled about the rigorous, almost paranoic, awareness and research of the social responsibility that AI developers and solution providers should exert.

IMG_20181215_093303

Role of Ethics in AI

The event started with playback of the recorded keynote address by distinguished researchers of Microsoft AI. It was probably the small shot of long black coffee I had just had, I sat there wide-eyed and amazed by the wise words of Hanna Wallach, Principal Researcher at Microsoft Research, NYC. Hanna’s research covers a broad range of topics; she was clearly passionate about the impact of AI on society – FATE (Fairness, Accountability, Transparency and Ethics in AI). I had never thought about ethics in AI the same way, but it made perfect sense.

The one reaction that the average Joe has to AI is the notion that it is almost magical, but always reliable and authentic. That’s a dangerous prejudice! AI, much like any other branch of science, can be used for good or bad. The elevated status that AI enjoys amongst the masses, thanks to Hollywood movies, and research companies pitching AI as the field of science that would shape 21st century, leads to the belief that AI = TRUTH! Those in the know, are aware that inherent biases in training data sets lead to biases in scoring. My heart skips a beat just to think how a technologically illiterate person may be led to believe utter lies, much like the predictions of this highly controversial Israeli company – Faception. They claim to be able to apply facial personality analytics technology to predict a person’s IQ, their personality – whether they are an academic researcher or a terrorist, for instance, just by looking at their face.

Utilizing advanced machine learning techniques we developed and continue to evolve an array of classifiers. These classifiers represent a certain persona, with a unique personality type, a collection of personality traits or behaviors. Our algorithms can score an individual according to their fit to these classifiers (sic).

When Vanessa Love, Assistant Director of Integration and DevOps at Australian Bureau of Statistics, talked about Faception during her session – I ain’t afraid of no terminator – at the Bootcamp, my initial impression was that the company was called out on its claims and was obviously identified as a scam. I could resonate with her frustration and anger as she went on to explain how Faception was working with governments, and clients in Fintech and Retail. There are numerous such shocking applications of AI. For instance, Stanford researchers built an AI solution that could predict a person’s sexuality from facial analysis. The only aspect that is more appalling than the intent of their research is the fact that the average Joe doesn’t read the T&Cs – in this case, their model was correct only 81% and 71% of the times in predictions for males and females respectively. So, what about the 48 wrong predictions for every 152 correct predictions? Vanessa also mentioned Amazon’s AI enabled recruiting tool that was stood down due to racial and sexist biases. In this case, AI helped to reveal the truth about inherent historical bias in recruitment practices at one of the biggest technology companies. So, sometimes AI = TRUTH. Tricky? Food for thought!

Will AI enslave human beings?

The age-old question! This is a recurring question I am asked when I discuss AI with less technologically-literate acquaintances. I usually go on to explain how Machine Learning works, and the differences between Supervised and Unsupervised learning. The key point I try to drive home is that AI is not a person or a thing, and more importantly, like all software solutions, it is error prone and not to be taken for granted. When we do take technology for granted, self-driving cars kill people and auto-pilot programs crash planes. Technology is meant to aid and assist, not render humanity obsolete!

Developing AI, responsibly

Luckily, researchers like Hanna Wallach and Yoshua Bengio are actively working on building a code of conduct for AI research and application. A result of that vigil is the Montreal Declaration for Responsible Development of Artificial Intelligence, inked earlier this month. At the time, I read about it and quickly slid that thought to the slow sectors of my brain. I signed the declaration a little while ago. As a technologist, I not only have the responsibility to develop AI responsibly, but also educate others about the pros and cons of  AI solutions.

Other interesting learnings from the Bootcamp

Jernej Kavka, Software Architect at SSW Consulting, presented his experiments with Real-Time Face Recognition using Microsoft Cognitive Services. He explained how his team successfully reduced costs by 99% by applying caching and pre-processing. I found his session remarkable.

Joseph Zhou, Data Scientist and Solution Development Consultant at Avanade – talked about drag-and-drop AI using Azure Machine Learning Services. I found his session crisp and relevant. Later, Yousry Mohamed, Consultant at Readify, explained how to apply DevOps practices in Azure Machine Learning and automating model-selection using “a bit of simple code”. As always, Yousry’s presentation was animated and wonderful.

A day well spent!

Overall, it was a day well spent. Thanks to all sponsors and volunteers for making the event happen! I could tell everyone was excited to be there, and we all went home with various thoughts in our little heads, a little wiser than we were at start of the day. The thought in my head was – what about the Tesla driver who relied on the self-driving capability, what about the black Facebook employee who the soap dispenser denied, what happens when AI goes wrong?

Part 2: Predictive Modeling using R and SQL Server Machine Learning Services

Recap!

Part 1 of Predictive Modeling using R and SQL Server Machine Learning Services covered an overview of Predictive Modeling and the steps involved in building a Predictive Model. Using our sample dataset – Ski Resort rental data – we wanted to predict RentalCount for the year 2015, given the variables – Month, Day, Weekday, Holiday and Snow.

Part 1 covered:
– Getting data from a SQL Server database
– Preparing data for modeling
– Training models
– Comparing results and finalizing a model

We found that for this problem, predictions using the Decision Tree model were more accurate than the Linear Regression model. SQL Server Machine Learning Services (MLS) lets us train and test Predictive Models using R or Python, in the context of SQL Server. Thus, we can build T-SQL programs that contain embedded R/Python scripts that train on data stored in the database.

Deploy Machine Learning code with SQL Server

In this part, we will deploy the R code we wrote in Part 1 to SQL Server. To deploy, we will store the trained model in database and create a stored procedure that predicts using the model. This stored procedure can be invoked from applications.

1. Create Table for storing the model: Here, we create a table in SQL Server to store the trained model. The model will be used for prediction in step 3.

2001_CreateTableRentalRxModels.jpg

2. Create Stored Procedure for generating the model: This stored procedure will use the R scripts we wrote in Part 1 utilizing sp_execute_external_script introduced in SQL Server 2016. To execute sp_execute_external_script, first enable external scripts by using the statement – sp_configure ‘external scripts enabled’, 1;

The function to generate Decision Tree model – rxDTree – is part of the RevoScaleR package for R. RevoScaleR package includes numerous other R functions for importing, transforming, and analyzing data at scale. Point to note is that the functions run on the RevoScaleR interpreter, built on open-source R. It is engineered to leverage the multithreaded and multinode architecture of the host platform, meaning when R code executes within a SQL Server SP, it utilizes parallel processing.

2002_SPToGenerateTrainedDTreeModel

2003_generatetraineddtreemodel.jpg

3. Create Stored Procedure for prediction: Now that we have the model output, we can create an SP that would use the model to predict rental count for new data. Again, we are using the R code covered in Part 1, only that this time we are using it in a SQL Stored Procedure.

2004_SPToPredictRentalCountUsingDTreeModel.jpg

2005_PredictRentalCountForTestDataUsingDTreeModel.jpg


2006_PredictRentalCountUsingDTreeModel.jpg

Isn’t that just awesome? We have a Predictive Model that can be used within applications to predict rental count. Now that we have covered a sample project, in Part 3  of the series, I will share my experience using SQL Server Machine Learning Services to solve a problem at my work.

Before we conclude Part 2,

Predict using Native Scoring (SQL Server 2017*): In SQL Server 2017, Microsoft has introduced a native predict function. What this means is we do not need to run R/Python code in a SQL stored procedure to do the actual prediction. Native scoring uses native C++ libraries that reads a trained model stored in binary format (in our case in a SQL Server table), and generate scores for new input data.

2007_CreateTableNativeModelSupport.jpg

2008_GenerateNativeModel.jpg

2010_PredictionUsingNativePredictFunction.jpg

Resources:

Scripts for Part 2: https://drive.google.com/file/d/15fwujRipLg-k2ozOFb9G9PFfBO327zTa/view?usp=sharing
RevoScaleR
https://docs.microsoft.com/en-us/machine-learning-server/r-reference/revoscaler/revoscaler
SQL Server ML Tutorial: https://microsoft.github.io/sql-ml-tutorials/R/rentalprediction/step/3.html
Native Scoring: https://docs.microsoft.com/en-us/sql/advanced-analytics/sql-native-scoring?view=sql-server-2017
RxSerializeModel: https://docs.microsoft.com/en-us/machine-learning-server/r-reference/revoscaler/rxserializemodel
Forecasts and Prediction using SQL Server MLS: https://docs.microsoft.com/en-us/sql/advanced-analytics/r/how-to-do-realtime-scoring?view=sql-server-2017

Part 1: Predictive Modeling using R and SQL Server Machine Learning Services

To R or not to R?

A few months ago, I asked myself an important question – which language to learn first – R or Python? From my research, I found that R is regarded as more old-school and difficult to learn, but Python is more popular. It made perfect sense to learn R first 🙂

For the uninitiated, R is a programming language that makes statistical and mathematical computation easy, and is useful for machine learning/predictive analytics/statistics work.

Along the way, I found the following courses useful.
https://www.edx.org/course/introduction-to-r-for-data-science
https://www.edx.org/course/programming-in-r-for-data-science

The goal has always been to explore Machine Learning Services in SQL Server, and dive deeper thereafter. This 3-part series is a walk through/review of Microsoft’s tutorial on Predictive Modeling using R and SQL Server. The first part deals with preparing data, training a model and using it for prediction.

What is Predictive Modeling?

Predictive Modeling uses statistics to predict outcomes.

In our example, we will use Machine Learning Services for SQL Server 2017 to predict number of rentals for a future date in a ski rental business. This brings up an important question – why do we want to predict? In this case, prediction will help the business be prepared from a stock, staff and facilities perspective. Prediction has numerous, life-changing applications. Read about application of AI in predicting cardiovascular disease by Microsoft for Apollo Hospitals, India.

For the ski rental prediction, we will use test data provided by MS, SQL Server 2017 with Machine Learning Services, and R Studio IDE. Please check the following URL and follow the simple instructions to set up your environment. If you have any question, please use Comments section to drop me a note.
https://microsoft.github.io/sql-ml-tutorials/R/rentalprediction

PredictiveModeling-Steps1

Steps involved in building the predictive model in SQL Server

  1. Getting data
  2. Preparing data
  3. Training models
  4. Comparing results and choosing a model
  5. Deploying the Machine Learning script to SQL Server

1. Getting Data: Okay, let’s get started. In the first step, we will restore sample database – TutorialDB – using the database backup file provided by MS. After restoring the database using SSMS, we will take a look at rental data we will use for training the model.

All scripts used will be provided in the Resources section at bottom of the page.

002_RestoreSampleDatabase-TutorialDB

003_ExamineTrainingData

You will see that we have 453 rows of rental stats. Data is in place, so we are good to move on to Step 2.

2. Preparing Data: Now that database is restored and data available in SQL Server, we will load data to R and transform it. Open R Studio and execute the rental data load script. After loading data, we will examine a few rows/observations and inspect data types. We will then proceed to change types of a few columns to factor.

004_loadrentaldatafromsqlserver.jpg

005_DataPreparation

3. Training Models: Now that data is prepared, we will chose a model that best describes dependency between variables in our dataset. During training, we provide the variables along with the outcome so that our model can train to predict the outcome. Here, we will compare predictions by two different models and choose the more accurate one as our predictive model.
For clarity, let me state that we are trying to predict RentalCount for the year 2015, given the variables – Month, Day, Weekday, Holiday and Snow.

The challenge in Machine Learning is in knowing what various models mean, and when a particular model might be more suitable. MS recommends this cheat sheet as a guide.

006_SplitDatasetToTrainingAndTest

007_TrainingUsingLinearRegressionAndDecisionTreeModels

008_RentalDataPrediction

Comparing results: Here, we compare results to figure out which model predicted more accurately. Decision Tree performed better in this case and we will use the model to deploy our Machine Learning Solution to SQL Server in Part 2

009_RentalDataPlotDifferencePredictedAndActual

Resources:

Scripts for Part 1 (zip file): https://drive.google.com/file/d/1Tzs4qzFXXL-NgxFlKQcuVHKwx90Imr8u/view?usp=sharing
SQL Server R tutorials: https://docs.microsoft.com/en-us/sql/advanced-analytics/tutorials/sql-server-r-tutorials?view=sql-server-2017
Gitghub repo for rental prediction: https://microsoft.github.io/sql-ml-tutorials/R/rentalprediction/
Machine Learning cheat sheet, use with caution 🙂 https://docs.microsoft.com/en-us/azure/machine-learning/studio/algorithm-choice#the-machine-learning-algorithm-cheat-sheet

Azure Cosmos DB Free Trial – walk through of Gremlin API for Graph

After the 2018 Microsoft Ignite event, Microsoft announced a free trial of Azure Cosmos DB. For those who are eager to check out Cosmos DB, this is a great opportunity to familiarize yourself with the hottest No SQL database in the market. Cosmos DB is currently sitting pretty at Rank 29 in the DB Engines Ranking page. Quite an achievement considering that the product is “only 1 year old”.

MS recently went public with the support for Cassandra API. A few years from now, Cosmos DB will be the most popular database offering from Microsoft. If you want to get a gentle intro to Cosmos DB, check out my previous posts – Introduction to Azure Cosmos DB and Azure Cosmos DB – Partition and Throughput.

This article is a walk through of using the Free Trial to get started with Cosmos DB.

Limited Time Free Trial: https://azure.microsoft.com/en-au/try/cosmosdb/

There is no need for a credit card or subscription to avail this free trial. Please do note though that MS is likely to withdraw trial in a few months.

Step 1: Choosing an API/data model
Once you click the above URL, you will be asked to pick an API and data model. Go ahead and pick SQL to check out document (JSON) data model if you are unsure. I want to check out Gremlin API for Graph, so I am choosing Graph in this example.
You will be asked to login with your Microsoft account. If you don’t have one, create a new account.

CosmosDB Trial

Step 2: Choose default options and click on Create container.
Note that container will be created free of cost at a low throughput of 400 RU/s. If you are not familiar with throughput, read my article about Azure Cosmos DB – Partition and Throughput.
You now have a brand new container and the familiar Azure portal access. My trial container has read/write location of Central US.

Azure Portal Database

Closer look: There is a lot going on here, so let us take a closer look.
My container is called Persons and it is in graphdb database. Cosmos DB uses Apache Tinkerpop Gremlin API for graph traversal. Currently, my container Persons is empty, so let us connect a sample application. If you are new to Graph DB, I recommend reading this free ebook from another popular Graph DB product – Neo4j.
https://neo4j.com/graph-databases-book/

Graph DB - Persons

Step 3: Sample project
Click on the Quick start blade to download a sample project and explore graph data.
The sample project already has the connection string set to the trial database, so we can execute the project right away. How awesome is that!

Quickstart

In Step 1, I chose Graph API and model, so my sample project has Gremlin API queries. Read more about Gremlin API here – https://aka.ms/gremlin.

Gremlin API Queries

Step 4: Execute sample project
Now it’s time to execute the project!

Sample Program Execution

Step 5: Data Explorer
Looks like the program has added a number of graph documents to the container. Let us head over to Azure Portal and explore using Data Explorer blade. Click on the Execute Gremlin Query button to take a look at the data added by sample program. Now let us take a closer look at the output.

Graph DB Data Explorer.jpg

Closer look: A quick look shows that the query g.V() returned 4 nodes. Result can be viewed in either JSON or Graph mode.

Output - closer look 1

If we click on the second node – Ben – and zoom in, we get a nice graphical view of ben’s relationships. Click and explore to view related nodes.

Output - closer look 3

Switch to JSON mode to view result in JSON format. Pretty self-explanatory there 🙂

Output - closer look 2

Step 6: Monitor activity
Head over to Activity Log blade to take a look at activity in the Cosmos DB account. This could be downloaded as a .csv or exported to Event Hub for further analysis.

Activity Log

Summary

We took a look at the Cosmos DB Trial offered by Microsoft and got started with Graph API. Graph DB has a number of attractive use cases such as Fraud Detection and Recommendation Engine. Another popular Graph DB is Neo4j. I hope this article helped you understand how powerful Cosmos DB’s multi model support is. If you have any questions, drop me an email or add a comment. I will be happy to help. Add me on LinkedIn to stay connected – https://www.linkedin.com/in/arjunsivadasan/

Further Reading

  1. Introduction to Azure Cosmos DB and Azure Cosmos DB – Partition and Throughput
  2. Intro to Cassandra API in Cosmos DB – https://docs.microsoft.com/en-us/azure/cosmos-db/cassandra-introduction
  3. Intro to Graph DB – https://neo4j.com/graph-databases-book/
  4. Explore Gremlin API – https://aka.ms/gremlin
  5. Cosmos DB playground – https://www.documentdb.com/sql/demo
  6. Microsoft Ignite 2018 Updates – https://news.microsoft.com/uploads/prod/sites/507/2018/09/IGNITEBOOKOFNEWS-5ba95469d658b.pdf